. 2011 Mar;62(6):1927-38.
doi: 10.1093/jxb/erq387. Epub 2011 Feb 4.

Identification and characterization of genomic regions on chromosomes 4 and 8 that control the rate of photosynthesis in rice leaves

Affiliations

Identification and characterization of genomic regions on chromosomes 4 and 8 that control the rate of photosynthesis in rice leaves

Shunsuke Adachi et al. J Exp Bot. 2011 Mar.

Abstract

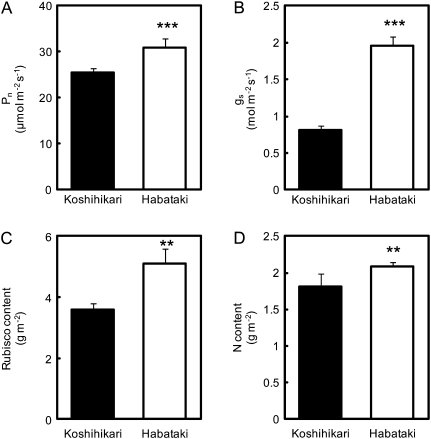
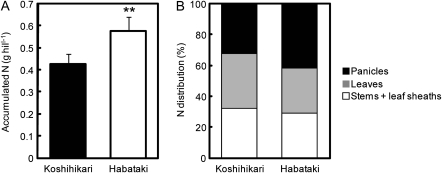
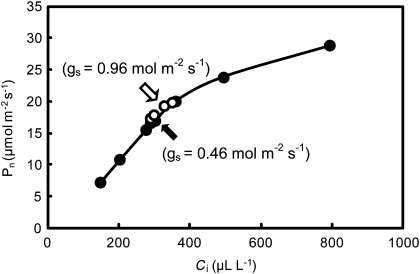
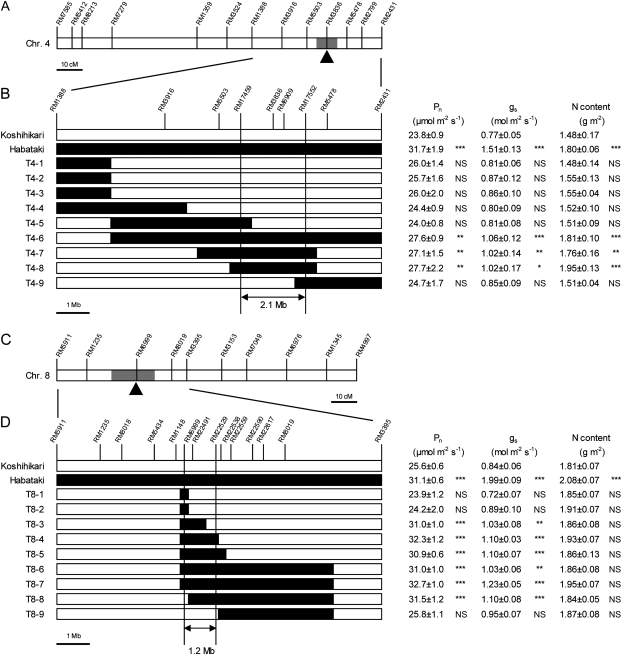
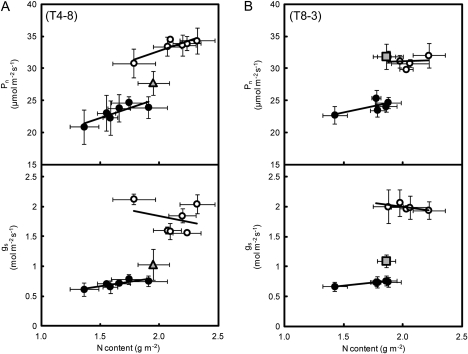
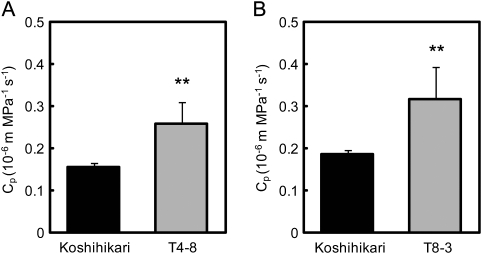
DNA marker-assisted selection appears to be a promising strategy for improving rates of leaf photosynthesis in rice. The rate of leaf photosynthesis was significantly higher in a high-yielding indica variety, Habataki, than in the most popular Japanese variety, Koshihikari, at the full heading stage as a result of the higher level of leaf nitrogen at the same rate of application of nitrogen and the higher stomatal conductance even when the respective levels of leaf nitrogen were the same. The higher leaf nitrogen content of Habataki was caused by the greater accumulation of nitrogen by plants. The higher stomatal conductance of Habataki was caused by the higher hydraulic conductance. Using progeny populations and selected lines derived from a cross between Koshihikari and Habataki, it was possible to identify the genomic regions responsible for the rate of photosynthesis within a 2.1 Mb region between RM17459 and RM17552 and within a 1.2 Mb region between RM6999 and RM22529 on the long arm of chromosome 4 and on the short arm of chromosome 8, respectively. The designated region on chromosome 4 of Habataki was responsible for both the increase in the nitrogen content of leaves and hydraulic conductance in the plant by increasing the root surface area. The designated region on chromosome 8 of Habataki was responsible for the increase in hydraulic conductance by increasing the root hydraulic conductivity. The results suggest that it may be possible to improve photosynthesis in rice leaves by marker-assisted selection that focuses on these regions of chromosomes 4 and 8.


Figures

Fig. 1.
Fig. 1.
Comparison of the rates of photosynthesis (Pn; A), stomatal conductance (gs; B), Rubisco contents (C), and nitrogen (N) contents (D) of flag leaves of Koshihikari and Habataki after growth in the paddy field under submerged conditions to the full heading stage. Pn and gs were measured with an LI-6400 system between 08:30 and 11:00. Vertical bars represent the SD (n=5). Asterisks ** and *** indicate significance at the 0.01 and 0.001 level, respectively, as compared with Koshihikari (t-test).
Fig. 2.
Fig. 2.
Accumulated nitrogen in aboveground parts (A) and the nitrogen (N) distribution rates to panicles, leaves, and stems plus leaf sheaths (B) in Koshihikari and Habataki after growth in the paddy field to the full heading stage. Asterisks ** indicate significance at the 0.01 level as compared with Koshihikari (t-test).
Fig. 3.
Fig. 3.
Rates of photosynthesis (Pn) plotted against the intercellular CO2 concentration (Ci) of the flag leaf with similar nitrogen content in Koshihikari (filled circles) and Habataki (open circles) after growth in 3.0 l pots under submerged conditions to the full heading stage. The filled (Koshihikari) and open (Habataki) arrows indicate rates at an ambient CO2 concentration of 370 μl l−1. The measurements were made with an LI-6400 system.
Fig. 4.
Fig. 4.
QTL analysis and substitution mapping of genes for the leaf photosynthetic rate on chromosomes 4 and 8. (A and C) Chromosomal locations of QTLs that control the rate of photosynthesis. The open bars indicate the entire chromosomes. SSR markers used in the QTL analysis are indicated above the bars. The shaded bars indicate the confidence intervals of the QTLs detected by analysis of the BC5F2 populations. The arrowheads indicate the most likely position of the QTLs, as determined by composite interval mapping. (B and D) Substitution mapping of the QTLs that control leaf photosynthesis. The genotypes of Koshihikari, Habataki, and homozygous recombinant lines are shown schematically on the left. SSR markers used are indicated at the top of each panel. White bars, homozygous for Koshihikari alleles; black bars, homozygous for Habataki alleles. All other chromosome regions of the lines, which were not shown in the figure, were homozygous for Koshihikari alleles. On the right, the rate of photosynthesis (Pn), stomatal conductance (gs), and the nitrogen (N) content of flag leaves of plants after growth in the paddy field to the full heading stage. Data are means ±SD (n=5). The measurements of Pn and gs were made with an LI-6200 system (C) and an LI-6400 system (D) at an ambient CO2 concentration of 370 μl l−1 between 08:30 and 11:00. The candidate genomic regions for the control of the rate of photosynthesis are indicated by double-headed arrows below the genotypes. Asterisks *, ** and *** indicate significance at the 0.05, 0.01, and 0.001 level, respectively, as compared with Koshihikari (Dunnett's test). NS, no significant difference.
Fig. 5.
Fig. 5.
Relationships between nitrogen content (N) and the rate of photosynthesis (Pn; upper panels) and stomatal conductance (gs; lower panels) of flag leaves of homozygous recombinant lines and parental cultivars after growth in the paddy field to the full heading stage. Filled circles, open circles, shaded triangles (in A) and shaded squares (in B) represent Koshihikari, Habataki, T4-8, and T8-3, respectively. The measurements in (A) were made with an LI-6200 system and those in (B) were made with an LI-6400 system at an ambient CO2 concentration of 370 μl l−1 between 08:30 and 11:00. Vertical and horizontal bars represent the SD (n=5).
Fig. 6.
Fig. 6.
Hydraulic conductance from roots to the flag leaf (Cp) in T4-8 (A) and T8-3 (B) compared with that in Koshihikari after growth in the paddy field to the ripening stage. Cp was expressed on a per leaf area basis. Vertical bars represent the SD (n=5). Asterisks ** indicate significance at the 0.01 level, as compared with Koshihikari (t-test).

References

    1. Asanuma S, Nito N, Ookawa T, Hirasawa T. Yield, dry matter production and ecophysiological characteristics of rice cultivar, Habataki compared with cv. Sasanishiki. Japanese Journal of Crop Science. 2008;77:474–480.
    1. Asanuma S, Ookawa T, Kondo M, Yano M, Ando T, Hirasawa T. QTL analysis of water transport capacity in rice: resistance to water transport in the lines of Habataki chromosome segment substitution in Sasanishiki. Proceedings of the 2nd International Conference on Rice for the Future. 2007:237.
    1. Basten CJ, Weir BS, Zeng ZB. A reference manual and tutorial for QTL mapping. Raleigh, NC: North Carolina State University; 2002. QTL cartographer. Version 1.16.
    1. Brodribb TJ, Field TS, Jordan GJ. Leaf maximum photosynthetic rate and venation are linked by hydraulics. Plant Physiology. 2007;144:1890–1898. - PMC - PubMed
    1. Cernusak LA, Winter K, Turner BL. Plant δ15N correlates with the transpiration efficiency of nitrogen acquisition in tropical trees. Plant Physiology. 2009;151:1667–1676. - PMC - PubMed

Publication types