

doi: 10.1098/rsif.2010.0729.
Epub 2011 Feb 4.
A simple DNA gate motif for synthesizing large-scale circuits
Affiliations
- PMID: 21296792
- PMCID: PMC3140723
- DOI: 10.1098/rsif.2010.0729
Item in Clipboard
A simple DNA gate motif for synthesizing large-scale circuits
J R Soc Interface.
.
Abstract
The prospects of programming molecular systems to perform complex autonomous tasks have motivated research into the design of synthetic biochemical circuits. Of particular interest to us are cell-free nucleic acid systems that exploit non-covalent hybridization and strand displacement reactions to create cascades that implement digital and analogue circuits. To date, circuits involving at most tens of gates have been demonstrated experimentally. Here, we propose a simple DNA gate architecture that appears suitable for practical synthesis of large-scale circuits involving possibly thousands of gates.
Figures
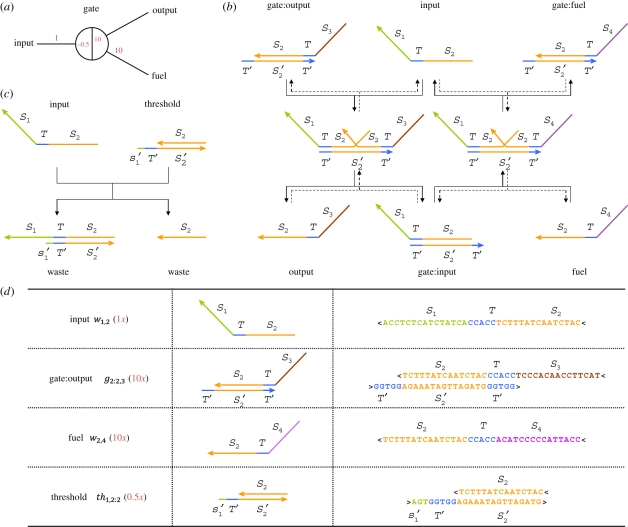
The DNA motif for ‘seesaw’ gates. (a) Abstract gate diagram. Red numbers indicate initial concentrations. (b) The DNA gate motif and reaction mechanism. S1, S2, S3 and S4 are the recognition domains; T is the toehold domain; T′ is the Watson–Crick complement of T, etc. Arrowheads mark the 3′ ends of strands. Signal strands are named by their domains from 3′ to 5′, i.e. from left to right, so the input is S1TS2; gate base strands and threshold bottom strands are named by their domain from 5′ to 3′. All reactions are reversible and unbiased; solid lines indicate the dominant flows for the initial concentrations shown in (a), while the reverse reactions are dotted. (c) The threshold motif and reaction mechanism. The toehold is extended by a few bases (s′1, the complement of the first few 5′ bases of S1), providing an increased rate constant relative to the gate itself. Branch migration intermediate states are omitted from the diagram. (d) Example sequences. Gate complexes and signal molecules are shown at the domain level (second column) and at the sequence level (third column). Here, recognition domain sequences are 15 nt, the toehold domain sequence is 5 nt, and the toehold is extended by 3 nt for the threshold. Other lengths are possible, so long as they ensure that recognition domains will not spontaneously dissociate, toehold exchange is fast, and thresholding is sufficiently faster.
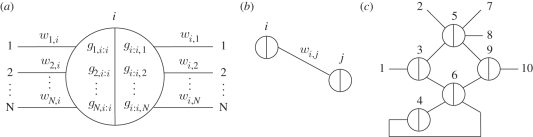
Abstract diagrams for seesaw gate circuits. (a) The general form of a gate node. Each gate i may be connected to many wires on each side, potentially all N nodes in the network, including itself. For each wire from the right side of gate i to the left side of gate j, the initial concentration of the free signal wi,j may be written above the wire, and the initial concentrations of gate complex gj,i:i (wj,i bound to gate i) and gi:i,j (wi,j bound to gate i) may be written within the node at the ends of the corresponding wires. Gate concentrations are simply omitted if they are zero. Initial concentrations of thj,i:i (the threshold for wj,i arriving at gate i) and thi:i,j (the threshold for wi,j arriving at gate i) may be written in the same locations as gj,i:i and gi:i,j, respectively, but as negative numbers—or omitted if they are zero. (b) The general form of a wire. Each wire is specifically connected on its left end to the right side of a gate node, and connected on its right end to the left side of a gate node. (c) An example circuit with five realized gates (numbered circles), five virtual gates (numbers at ends of wires), and 11 wires. Each wire is identified by the two gates it connects; thus the virtual gates serve to provide full names (and sequences) to their incident wires. Note that circuit diagrams may be drawn without providing gate numbers, as they are not relevant to circuit function.
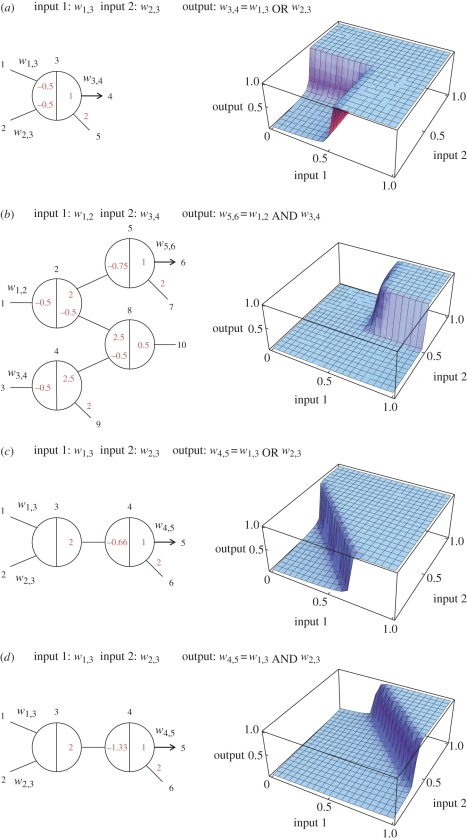
Circuit diagrams and input/output behaviour of boolean logic gates. Output wires with arrowheads indicate that a downstream load is assumed, which consumes signal strands as they are released. (a−b) A two-input OR gate and a two-input AND gate using, respectively, 1 and 4 seesaw gates, the ‘1-4 scheme’. Circuits constructed using the 1-4 scheme are not clean, and thus would perform worse if threshold crosstalk and threshold inhibition were modelled. (c–d) A two-input OR gate and a two-input AND gate using two seesaw gates each, the ‘2-2 scheme’. Circuits constructed using the 2-2 scheme are clean. All simulations were performed with the reference concentration 1x = 50 nM, and stopped at t = 10 h. Here and in all other simulations, kf = 2 × 10⁶ M−1 s−1 and ks = 105 M−1 s−1.
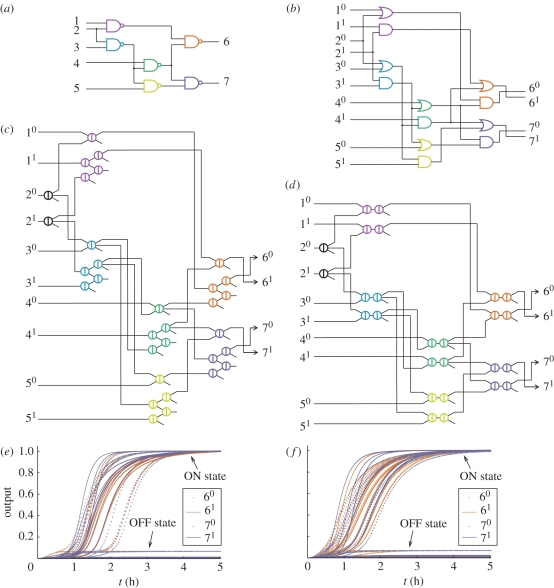
Compiling boolean logic circuits. (a) A sample circuit with six gates. (b) Translation into an equivalent dual-rail circuit with 12 gates. (c,d) Translation into an equivalent seesaw gate circuit with 32 gates (1-4 scheme) and 26 gates (2-2 scheme). (e,f) Simulation results for all 32 possible input vectors in the 1-4 scheme and in the 2-2 scheme. The concentrations of all four dual-rail output species are shown as a function of time. Delays vary with the input, depending the shortest decision path through the network. Simulations were run using the concentration 1x = 50 nM, with ON inputs at 0.9x and OFF inputs at 0.1x. For the 1-4 scheme, the simulated reaction equations were augmented to also model threshold crosstalk, which degrades the performance of OR gates—but the system still works.
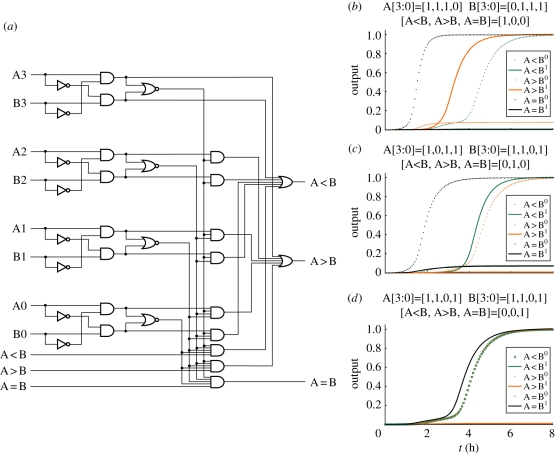
A 74L85 standard 4-bit magnitude comparator (four layers deep) and its seesaw circuit simulation, with 1x = 50 nM. (a) The digital logic circuit diagram. The corresponding seesaw circuit has roughly 100 seesaw gates. (b) Seesaw circuit simulation with selected input vector of A greater than B. (c) Seesaw circuit simulation with selected input vector of A smaller than B. (d) Seesaw circuit simulation with selected input vector of A equal to B.
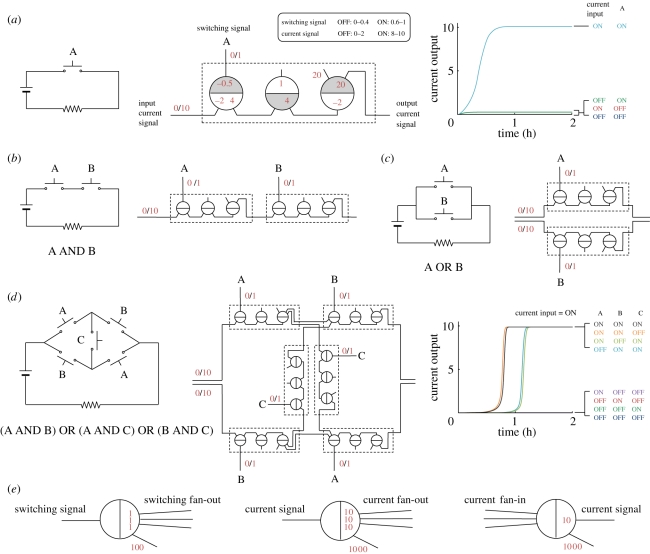
Implementation of relay circuits. (a) A simple circuit with current source (battery) and controlled device (denoted by a resistor), the corresponding seesaw gate circuit, and its simulation using 1x = 50 nM. Shaded and unshaded sides of seesaw gates assist checking that a wire always connects different sides of two seesaw gates as required by node polarity, i.e. each wire connects the shaded side of one seesaw gate to the unshaded side of another. Switching signal A is provided at 1x if ON, or else 0.1x if OFF. Input current signal was provided at 10x; to verify that no output signal is produced when the current input is OFF, a 1x signal was provided. (b) AND logic. (c) OR logic. (d) A more complex circuit. Overlapping trajectories (orange and light blue) were shifted to the left by 100 s to make them visible. (e) Switching signal fan-out, current signal fan-out and current signal fan-in.
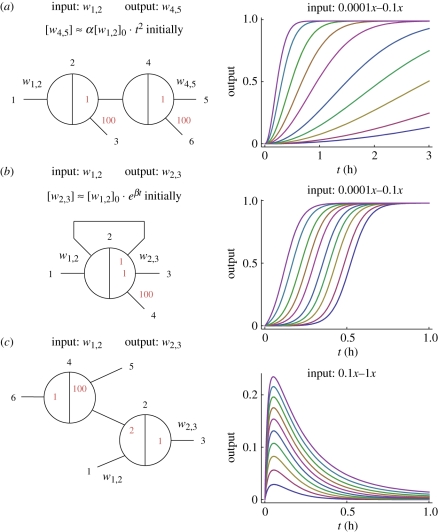
Analogue time-domain circuits. (a) A catalytic cascade that exhibits initially quadratic growth, with α ≈ 125 h−2. Temporal trajectories are shown for a series of exponentially decreasing initial input concentrations. (b) A positive feedback circuit that exhibits initially exponential growth, with β ≈ 17 h−1. The same series of exponentially decreasing input concentrations now yields a series of trajectories with linearly increasing half-completion times. (c) A pulse-generating circuit. Pulse amplitude depends on the input concentration. Here, we use a linear series of input concentrations between 0x and 1x. All simulations use 1x = 50 nM.
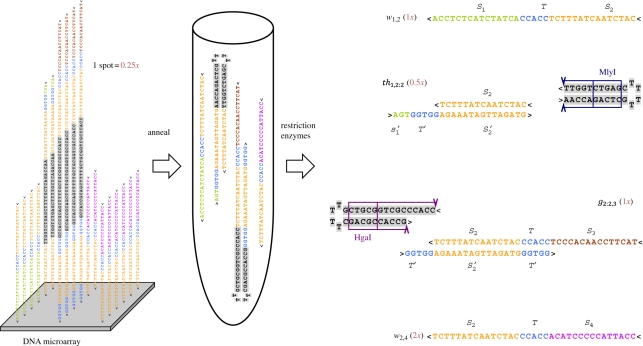
Parallel preparation of seesaw gates as hairpin precursors. Using DNA microarray synthesis technologies, each gate, threshold and fuel is made as a single strand. After cleavage from the surface, the mixture is annealed to form hairpins. Restriction enzymes then cleave the hairpins to form gate and threshold complexes. Relative concentrations (red numbers) are set based on the number of DNA chip spots dedicated to a given strand; in this example, one spot produces 0.25x.
References
-
- Tang J., Breaker R. R. 1997. Rational design of allosteric ribozymes. Chem. Biol. 4, 453–459 10.1016/S1074-5521(97)90197-6 (doi:10.1016/S1074-5521(97)90197-6) - DOI - PubMed
-
- Turberfield A. J., Mitchell J. C., Yurke B., Mills A. P., Jr, Blakey M. I., Simmel F. C. 2003. DNA fuel for free-running nanomachines. Phys. Rev. Lett. 90, 118102 10.1103/PhysRevLett.90.118102 (doi:10.1103/PhysRevLett.90.118102) - DOI - PubMed
-
- Zhang D. Y., Turberfield A. J., Yurke B., Winfree E. 2007. Engineering entropy-driven reactions and networks catalyzed by DNA. Science 318, 1121–1125 10.1126/science.1148532 (doi:10.1126/science.1148532) - DOI - PubMed
-
- Stojanovic M. N., Mitchell T. E., Stefanovic D. 2002. Deoxyribozyme-based logic gates. J. Am. Chem. Soc. 124, 3555–3561 10.1021/ja016756v (doi:10.1021/ja016756v) - DOI - PubMed
-
- Hagiya M., Yaegashi S., Takahashi K. 2006. Computing with hairpins and secondary structures of DNA. In Nanotechnology: science and computation, (eds Chen J., Jonoska N., Rozenberg G.), pp. 293–308 Berlin, Germany: Springer; 10.1007/3-540-30296-4_18 (doi:10.1007/3-540-30296-4_18) - DOI
Publication types
MeSH terms
Substances
LinkOut - more resources
Full Text Sources
Other Literature Sources