. 2011 May 17;52(6):3281-92.
doi: 10.1167/iovs.10-6538.

Cone photoreceptor abnormalities correlate with vision loss in patients with Stargardt disease

Affiliations

Cone photoreceptor abnormalities correlate with vision loss in patients with Stargardt disease

Yingming Chen et al. Invest Ophthalmol Vis Sci. .

Abstract

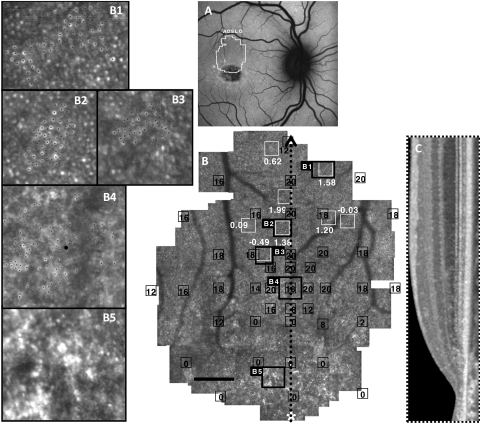
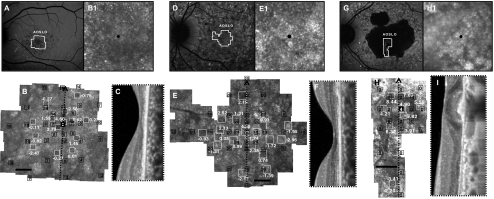
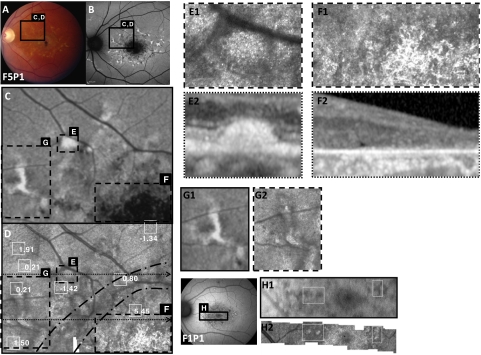
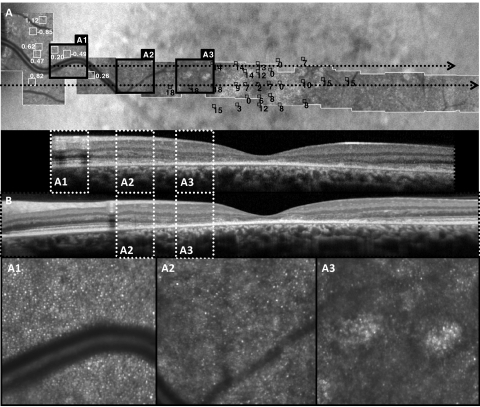
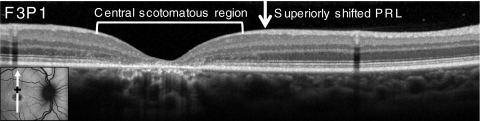
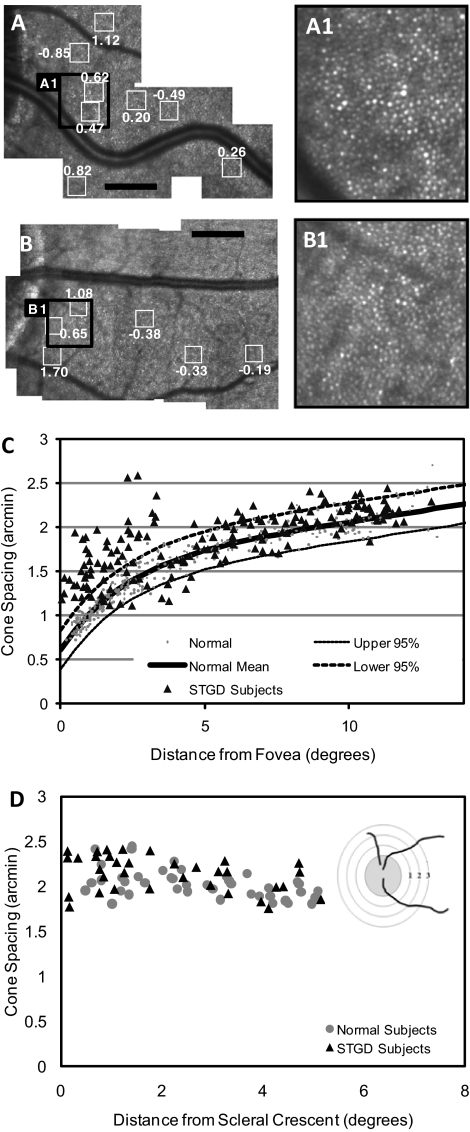
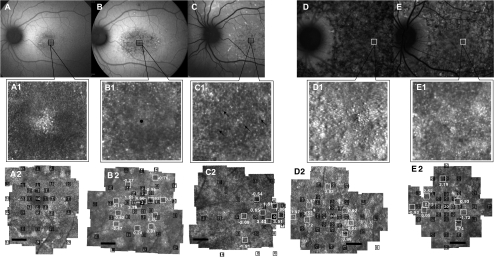
PURPOSE. To study the relationship between macular cone structure, fundus autofluorescence (AF), and visual function in patients with Stargardt disease (STGD). METHODS. High-resolution images of the macula were obtained with adaptive optics scanning laser ophthalmoscopy (AOSLO) and spectral domain optical coherence tomography in 12 patients with STGD and 27 age-matched healthy subjects. Measures of retinal structure and AF were correlated with visual function, including best-corrected visual acuity, color vision, kinetic and static perimetry, fundus-guided microperimetry, and full-field electroretinography. Mutation analysis of the ABCA4 gene was completed in all patients. RESULTS. Patients were 15 to 55 years old, and visual acuity ranged from 20/25-20/320. Central scotomas were present in all patients, although the fovea was spared in three patients. The earliest cone spacing abnormalities were observed in regions of homogeneous AF, normal visual function, and normal outer retinal structure. Outer retinal structure and AF were most normal near the optic disc. Longitudinal studies showed progressive increases in AF followed by reduced AF associated with losses of visual sensitivity, outer retinal layers, and cones. At least one disease-causing mutation in the ABCA4 gene was identified in 11 of 12 patients studied; 1 of 12 patients showed no disease-causing ABCA4 mutations. CONCLUSIONS. AOSLO imaging demonstrated abnormal cone spacing in regions of abnormal fundus AF and reduced visual function. These findings provide support for a model of disease progression in which lipofuscin accumulation results in homogeneously increased AF with cone spacing abnormalities, followed by heterogeneously increased AF with cone loss, then reduced AF with cone and RPE cell death.


Figures

Figure 1.
Figure 1.
Images of F3P1: (A) AF. (B) AOSLO with MP1 sensitivities (black boxes and values, dB) and cone spacing measurements (white boxes and values, z-scores). (C) Vertical SD-OCT transecting fixation. (B1B3, insets) Cones used for cone spacing measures (black dots). (B4) PRL with abnormal cone morphology. (B5) Lack of unambiguous cones in a region of RPE atrophy surrounding the anatomic fovea (*). Scale bar, 1°.
Figure 2.
Figure 2.
Cone structure in Stargardt patients with foveal sparing. Images of F1P1: (A) AF. (B) AOSLO with MP1 sensitivities and cone spacing. (B1, inset) Dim cones at the anatomic fovea (black dot). (C) SD-OCT shows disrupted IS/OS junction at the fovea. Images of F2P1: (D) AF. (E) AOSLO with MP1 sensitivities and cone spacing. Cone spacing was patchy with variable spacing relative to normal. (E1, inset) Coarse cones at the fixation locus, the anatomic fovea (black dot). (F) SD-OCT shows disrupted IS/OS junction at the fovea. Images of F11P1: (G) Fundus autofluorescence; (H) Cone spacing was significantly increased where sensitivities were measurable near the anatomic fovea (H1, inset, black dot). (I) SD-OCT shows preserved retinal and RPE structure at the fovea, although the RPE is thickened and associated with shadowing posteriorly, and the IS/OS junction is attenuated. For all three subjects, MP1 sensitivities (black boxes and values, dB) and AOSLO cone spacing measurements (white boxes and values, z-scores) are superimposed. Black scale bar, 1° (B, E, H).
Figure 3.
Figure 3.
Images of F5P1 (AG) and F1P1 (H): (A) Fundus. (B) AF. (C) Enlarged AF image of the region outlined in black in (A) and (B). (D) Corresponding AOSLO image with cone spacing measurements at locations outlined with white square boxes indicated with z-scores, or numbers of standard deviations away from the normal mean at that location. (E, F) Enlarged AOSLO (E1, F1) and SD-OCT (E2, F2) images of the regions outlined with dashed lines in (C) and (D). (D, dotted arrows) Positions of SD-OCT scans. Hyperreflective structures are present over flecks (E1, E2). (D) Area between black dashed lines indicates the transition zone between intact and absent cones. Hyperreflective regions without cones (F1) are seen in regions of atrophy on AF (F) and SD-OCT (F2). (G, H) Hyperreflective structures seen on AOSLO (G2, H2) correlate to both hypoautofluorescent regions on AF (G1), but in other patients hyperreflective structures correlate to hyperautofluorescent regions on AF. (H1) Patient F1P1.
Figure 4.
Figure 4.
Dim regions with sparse cones are found in the transition zone between atrophy and more normal outer retinal structure. (A) AOSLO image with MP1 overlay and cone spacing measurements at locations outlined with black and white square boxes, respectively, in patient F1P1. Insets in the lower panel are outlined with bold squares on the AOSLO montage. (B) Two horizontal SD-OCT scans, the lower scan transecting the fovea, are shown, with regions corresponding to the same insets outlined with white dashes. Cone spacing measures were normal where cones were visualized near the disc (A1), whereas sparse cones were seen in transitional regions with preserved sensitivity (small black square boxes). The IS/OS junction was visible on SD-OCT (B) in regions with normal cone spacing (A1) and between normal cones and atrophy (A2), but unambiguous cones were not seen where the IS/OS junction was disrupted (A3).
Figure 5.
Figure 5.
SD-OCT scan through the anatomic fovea (white arrow in inset AF image) and PRL of fixation (black plus sign in inset) of patient F3P1 with eccentric fixation and central atrophy. The region of eccentric fixation was located in a transition zone where the outer nuclear layer and the IS and OS layers were present but were thin and disrupted.
Figure 6.
Figure 6.
Normal cone spacing near the optic disc. AOSLO images in the parapapillary region of F1P1 (A) and a healthy subject (B). Cone spacing measurements in various locations (white boxes around the ONH) are shown. Black scale bar, 1°. (A1) and (B1) are magnified images of the regions shown on the larger montages (A) and (B). (C) Cone spacing versus distance from the fovea. Cone spacing measurements on AOSLO were obtained for 8 of 12 patients in the study. Measurements were not performed for 4 of 12 patients (F6P1, F8P1, F9P1, F10P1) because of the lack of unambiguous cone mosaics in the imaged region as a result of unstable fixation or cone atrophy in areas of reduced vision. (D) Cone spacing versus distance from the scleral crescent. Diagram illustrates how measurements were taken. Distance was measured radially in degrees from the edge of the scleral rim. (C, D) Healthy subjects (gray circles); patients with STGD (black triangles).
Figure 7.
Figure 7.
AF, AOSLO, and MP1 responses of F1P1 (AC) and F2P1 (D, E) obtained over 27 months. F1P1: visit 1 (A), visit 2 (B) 15 months after visit 1, and visit 3 (C) 27 months after visit 1. The region of heterogeneous AF adjacent to the central region of reduced AF extended from the fovea in all directions. AOSLO images with MP1 sensitivities (black boxes and values, dB) and cone spacing measurements (white boxes and values, z-scores) show the disappearance of a foveal cone island followed by the appearance of scattered RPE cells (arrows; A1, B1, C1), coinciding with the loss of central visual sensitivity on microperimetry (A2, B2, C2). Fixation shifted superonasally at the 27-month visit; the vascular landmarks seen in the inferotemporal portions of (A2) and (B2) are not visualized. F2P1: visit 1 (D) and 2 (E) 27 months after visit 1. AOSLO images from both visits show coarse, disorganized cones at the fovea (D1, E1). Central visual sensitivity is preserved (D2, E2). Black scale bars, 1° (A2E2).

References

    1. Armstrong JD, Meyer D, Xu S, Elfervig JL. Long-term follow-up of Stargardt's disease and fundus flavimaculatus. Ophthalmology. 1998;105:448–457, discussion 457–448 - PubMed
    1. Fishman GA, Farber M, Patel BS, Derlacki DJ. Visual acuity loss in patients with Stargardt's macular dystrophy. Ophthalmology. 1987;94:809–814 - PubMed
    1. Glazer LC, Dryja TP. Understanding the etiology of Stargardt's disease. Ophthalmol Clin North Am. 2002;15:93–100, viii - PubMed
    1. Rotenstreich Y, Fishman GA, Anderson RJ. Visual acuity loss and clinical observations in a large series of patients with Stargardt disease. Ophthalmology. 2003;110:1151–1158 - PubMed
    1. Birnbach CD, Jarvelainen M, Possin DE, Milam AH. Histopathology and immunocytochemistry of the neurosensory retina in fundus flavimaculatus. Ophthalmology. 1994;101:1211–1219 - PubMed

Publication types

MeSH terms