

Neutral mitochondrial heteroplasmy and the influence of aging
- PMID: 21296868
- PMCID: PMC3063991
- DOI: 10.1093/hmg/ddr043
Neutral mitochondrial heteroplasmy and the influence of aging
Abstract
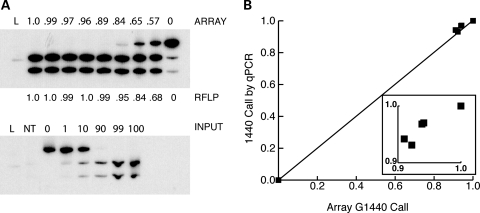
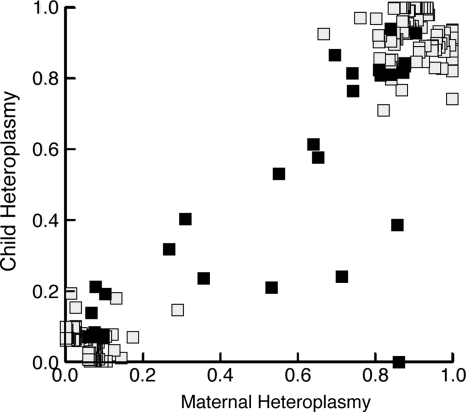
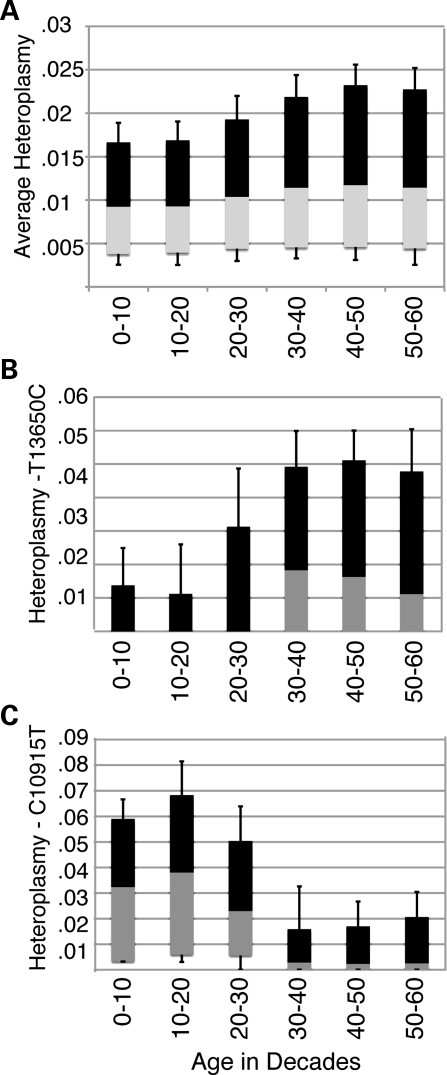
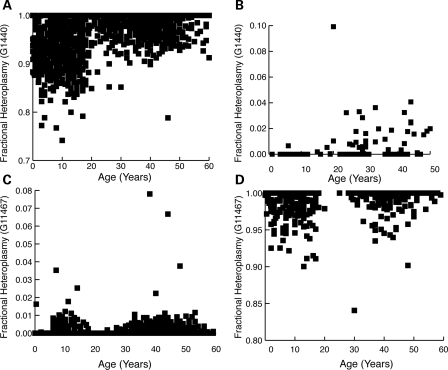
The development and maintenance of mitochondrial heteroplasmy has important consequences for both health and heredity. Previous studies using pathogenic mutations have shown considerable variability between maternally related individuals and studies of several D-loop polymorphisms have suggested a relationship between heteroplasmy and somatic aging. To broadly explore the variation of human heteroplasmy and to clarify the dynamics of somatic heteroplasmy over the course of lifespan, we analyzed mitochondrial sequence variation across a range of ages. We utilized array-generated single-nucleotide polymorphism data that were well correlated with independent measures of heteroplasmy. Significant levels of heteroplasmy were identified at 0.24% of sites evaluated. By examining mother-child pairs, we found that heteroplasmy was inherited (30%) but could occur de novo in offspring or, conversely, be present in mothers but eliminated in their children (70%). Cumulatively, mitochondrial heteroplasmy across the genome increased significantly with advanced age (r = 0.224, P =8 × 10(-30)). Surprisingly, changes in heteroplasmy were not uniform with some sites demonstrating a loss of variation (increased homoplasmy) with aging. These data suggest that both mutation and selective pressure affect blood mitochondrial DNA sequence over the course of the human lifespan and reveal the unexpectedly dynamic nature of human heteroplasmy.
Figures
References
-
- Chinnery P.F., Howell N., Lightowlers R.N., Turnbull D.M. Molecular pathology of MELAS and MERRF. The relationship between mutation load and clinical phenotypes. Brain. 1997;120:1713–1721. - PubMed
-
- Holt I.J., Harding A.E., Morgan-Hughes J.A. Deletions of muscle mitochondrial DNA in patients with mitochondrial myopathies. Nature. 1988;331:717–719. - PubMed
-
- Wallace D.C., Zheng X.X., Lott M.T., Shoffner J.M., Hodge J.A., Kelley R.I., Epstein C.M., Hopkins L.C. Familial mitochondrial encephalomyopathy (MERRF): genetic, pathophysiological, and biochemical characterization of a mitochondrial DNA disease. Cell. 1988;55:601–610. - PubMed
-
- de Camargo M.A., Paneto G.G., de Mello A.C., Martins J.A., Barcellos W., Cicarelli R.M. No relationship found between point heteroplasmy in mitochondrial DNA control region and age range, sex and haplogroup in human hairs. Mol. Biol. Rep. 2010;38:1219–1223. - PubMed
Publication types
MeSH terms
Substances
Grants and funding
LinkOut - more resources
Full Text Sources
Medical
