. 2011 Apr 1;286(13):11659-71.
doi: 10.1074/jbc.M110.203000. Epub 2011 Feb 4.

Inactivation of the mitochondrial carrier SLC25A25 (ATP-Mg2+/Pi transporter) reduces physical endurance and metabolic efficiency in mice

Affiliations

Inactivation of the mitochondrial carrier SLC25A25 (ATP-Mg2+/Pi transporter) reduces physical endurance and metabolic efficiency in mice

Rea P Anunciado-Koza et al. J Biol Chem. .

Abstract

An ATP-Mg(2+/)P(i) inner mitochondrial membrane solute transporter (SLC25A25), which is induced during adaptation to cold stress in the skeletal muscle of mice with defective UCP1/brown adipose tissue thermogenesis, has been evaluated for its role in metabolic efficiency. SLC25A25 is thought to control ATP homeostasis by functioning as a Ca(2+)-regulated shuttle of ATP-Mg(2+) and P(i) across the inner mitochondrial membrane. Mice with an inactivated Slc25a25 gene have reduced metabolic efficiency as evidenced by enhanced resistance to diet-induced obesity and impaired exercise performance on a treadmill. Mouse embryo fibroblasts from Slc25a25(-/-) mice have reduced Ca(2+) flux across the endoplasmic reticulum, basal mitochondrial respiration, and ATP content. Although Slc25a25(-/-) mice are metabolically inefficient, the source of the inefficiency is not from a primary function in thermogenesis, because Slc25a25(-/-) mice maintain body temperature upon acute exposure to the cold (4 °C). Rather, the role of SLC25A25 in metabolic efficiency is most likely linked to muscle function as evidenced from the physical endurance test of mutant mice on a treadmill. Consequently, in the absence of SLC25A25 the efficiency of ATP production required for skeletal muscle function is diminished with secondary effects on adiposity. However, in the absence of UCP1-based thermogenesis, induction of Slc25a25 in mice with an intact gene may contribute to an alternative thermogenic pathway for the maintenance of body temperature during cold stress.


Figures
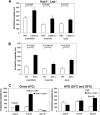
FIGURE 1.
FIGURE 1.
Gene expression of Slc25a25 in UCP1-deficient mouse models. A, gene expression in skeletal muscle of PBS and leptin-treated Ucp1−/−·Lep−/− mice adapted to 20 °C. Gast is gastronemius muscle. Muscle dissection is described under “Experimental Procedures.” B, gene expression in skeletal muscle of Dbh−/− (dopamine β-hydroxylase) mice adapted to 16 °C. C, gene expression in skeletal muscle and inguinal fat in Gdm−/− (mitochondrial glycerol-3-phosphate dehydrogenase) mice fed chow diet adapted to 4 °C and in high fat diet fed (HFD) mice were housed at 20 °C for 10 weeks and then at 28 °C for 10 weeks.
FIGURE 2.
FIGURE 2.
Generation and validation of Slc25a25 knock-out mice. A, scheme describing generation of Slc25a25 knock-out. Rectangles and triangles correspond to exons and loxP sites, respectively. B, genomic PCR to demonstrate the presence of 3 loxP sites in Slc25a25 wild-type, heterozygous floxed, and homozygous floxed mice. C, gene expression profile in liver, quadriceps, and inguinal fat showing Slc25a25 gene expression in wild-type (n = 3) and floxed mice (n = 3); and a reduction and absence of expression in heterozygotes (n = 3) and knock-out (n = 3) mice, respectively. Data are mean ± S.E.
FIGURE 3.
FIGURE 3.
Body weight and body composition in Slc25a25 wild-type (WT), heterozygous (HET), and KO mice. A, body weight, fat mass, and fat-free mass in Slc25a25 WT (n = 9–13), heterozygotes (n = 14–22), and KO (n = 9–22) mice fed chow diet and kept at 28 °C ambient temperature. Data are mean ± S.E. a and b, with different superscripts are significantly different at p < 0.05. B, body weight, fat mass and fat-free mass in Slc25a25 WT (n = 18) and KO (n = 11) mice a fed high fat diet, and kept at 20 and 28 °C ambient temperature for 20 weeks. Data are mean ± S.E. p < 0.01; #, WT versus KO.
FIGURE 4.
FIGURE 4.
Oxygen consumption and RER in Slc25a25 wild-type (WT) and KO mice. A, VO2 consumption and RER in 9-week-old WT (n = 5), heterozygous (n = 6), and KO (n = 5) mice fed a high fat diet for 8 days and exposed to 4 °C for 56 h. Bar graphs represent VO2 and RER for 24 h at 28 °C and 48 h at 4 °C. Data are mean ± S.E. a-c, means are statistically significant at p < 0.05. B, VO2 consumption in WT (n = 8) and KO (n = 8) mice fed high fat diet at 20 and 28 °C ambient temperature. Bar graph represents VO2 during light and dark hours for 3 days on week 10 at 20 °C and for 3 days on week 20 at 28 °C. Data are mean ± S.E.
FIGURE 5.
FIGURE 5.
Endurance phenotype and fiber-type distribution in Slc25a25 wild-type and knock-out mice. A, 12-week-old male Slc25a25 wild-type (n = 5), heterozygous (n = 5), and knock-out (n = 5) mice were subjected to forced treadmill endurance test. Slc25a25 knock-out mice have significantly reduced running time compared with wild-type mice. Data are mean ± S.E. a and b, statistically significant at p < 0.05. B, fiber type distribution in soleus muscle of Slc25a25 wild-type (n = 5), heterozygous (n = 5), and knock-out (n = 5) mice. Samples were collected 1 week post-endurance test. No significant difference in distribution of type 1 and type 2 fibers was observed.
FIGURE 6.
FIGURE 6.
Ca2+ flux and bioenergetic profile in MEF from Slc25a25 wild-type and KO mice. A, Ca2+ flux in WT and KO MEF exposed to 300 nm bradykinin, 1 μm thapsigargin, and 5 μm ionomycin. Data are from three independent experiments. Twenty replicates per genotype were used in each experiment. B, oxygen consumption rates (OCR) and extracellular acidification rates (ECAR) in WT and KO MEF. 5 μm oligomycin, 1 μm FCCP, and 1.5 μm antimycin A, 1 μm rotenone were injected at times indicated with measurements recorded after each injection. p < 0.05, *, WT versus KO. C, mitochondrial and non-mitochondrial respiration rates calculated from B. p < 0.05, Student's t test. D, cellular ATP levels in MEF at basal conditions and after a 1-min exposure to 5 μm oligomycin, 100 mm 2-deoxyglucose, 1 μm FCCP, 25 μm carboxyatractyloside, and 2 μm rotenone. All data presented are mean ± S.E.
FIGURE 7.
FIGURE 7.
Model of Slc25a25 and Gdm-mediated regulation of energy metabolism. SLC25A25 and Gdm are located in the inner mitochondrial membrane where they function through their Ca2+-binding domains to coordinate requirements for ATP production to support Ca2+ pumping by SERCA from the cytoplasm to the sarcoplasmic reticulum. Inactivation of one or both of these genes is proposed to effect ATP production with downstream effects on metabolic efficiency as evident from physical activity monitored on a treadmill and regulation of energy balance under cold stress. Modified from models published by Block (43) and Aprille (44).

Similar articles

Cited by

References

    1. Morton G. J., Cummings D. E., Baskin D. G., Barsh G. S., Schwartz M. W. (2006) Nature 443, 289–295 - PubMed
    1. Hawley J. A., Holloszy J. O. (2009) Nutr. Rev. 67, 172–178 - PubMed
    1. Kozak L. P. (2010) Cell Metab. 11, 263–267 - PMC - PubMed
    1. Zurlo F., Lillioja S., Esposito-Del Puente A., Nyomba B. L., Raz I., Saad M. F., Swinburn B. A., Knowler W. C., Bogardus C., Ravussin E. (1990) Am. J. Physiol. Endocrinol. Metab. 259, E650-E657 - PubMed
    1. Lowell B. B., Shulman G. I. (2005) Science 307, 384–387 - PubMed

Publication types

MeSH terms