. 2011 Apr;52(4):720-31.
doi: 10.1194/jlr.M011007. Epub 2011 Feb 4.

Hypoxia upregulates PGI-synthase and increases PGI₂ release in human vascular cells exposed to inflammatory stimuli

Affiliations

Hypoxia upregulates PGI-synthase and increases PGI₂ release in human vascular cells exposed to inflammatory stimuli

Mercedes Camacho et al. J Lipid Res. 2011 Apr.

Abstract

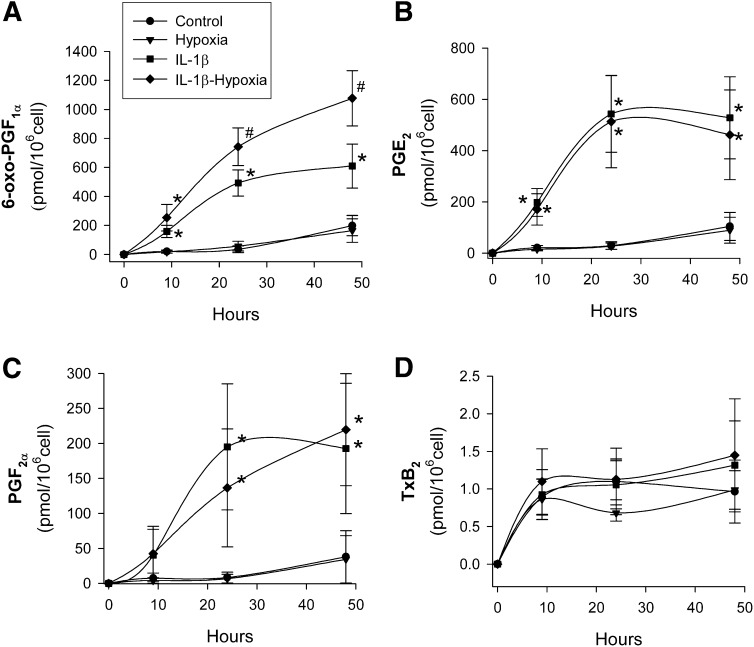
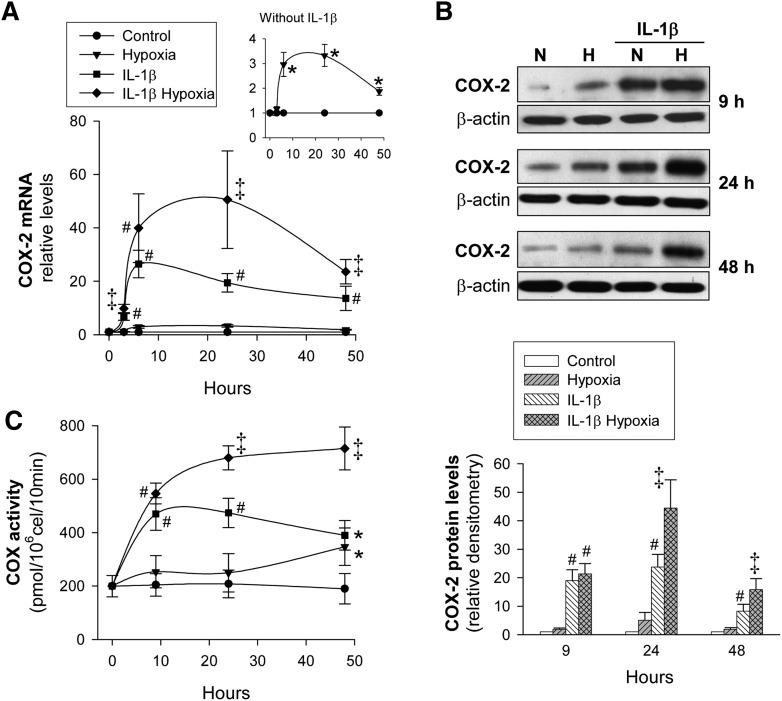
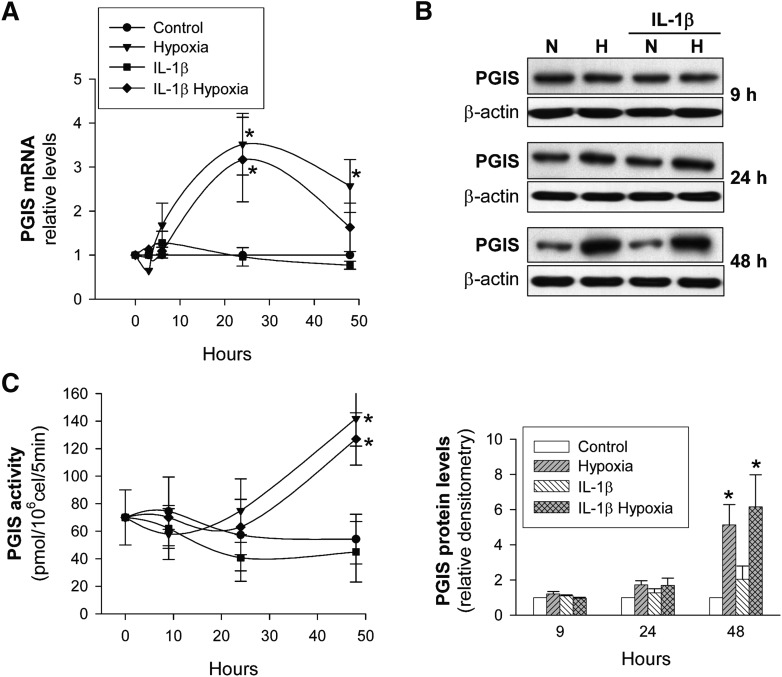
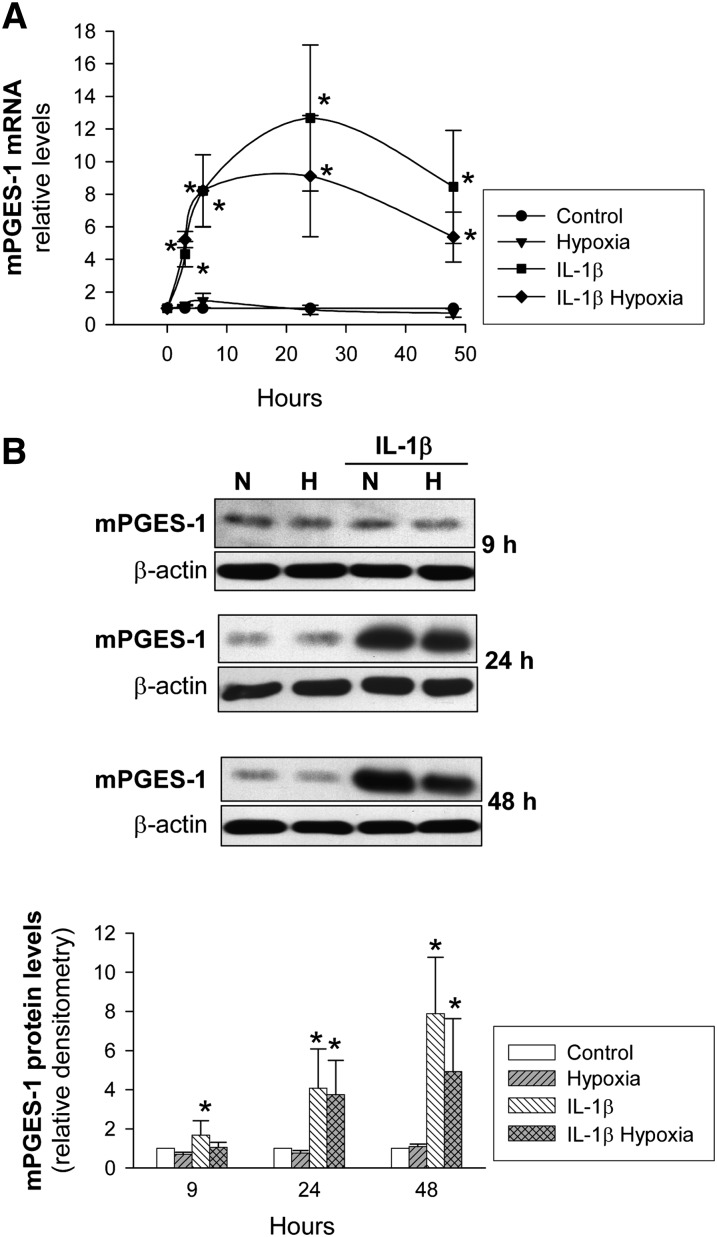
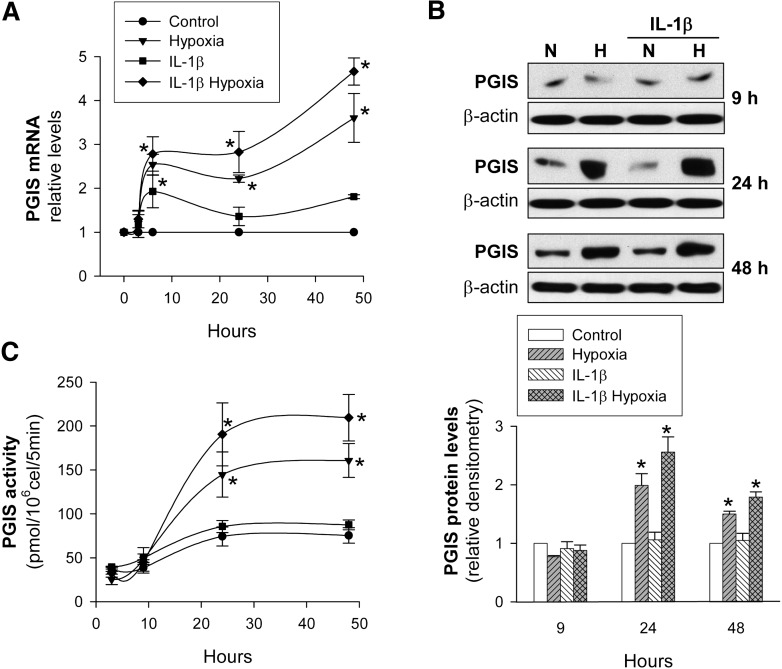
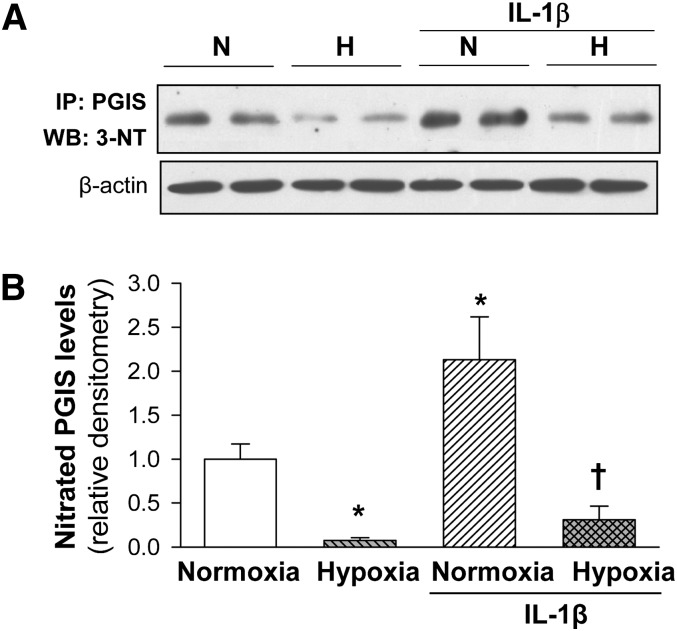
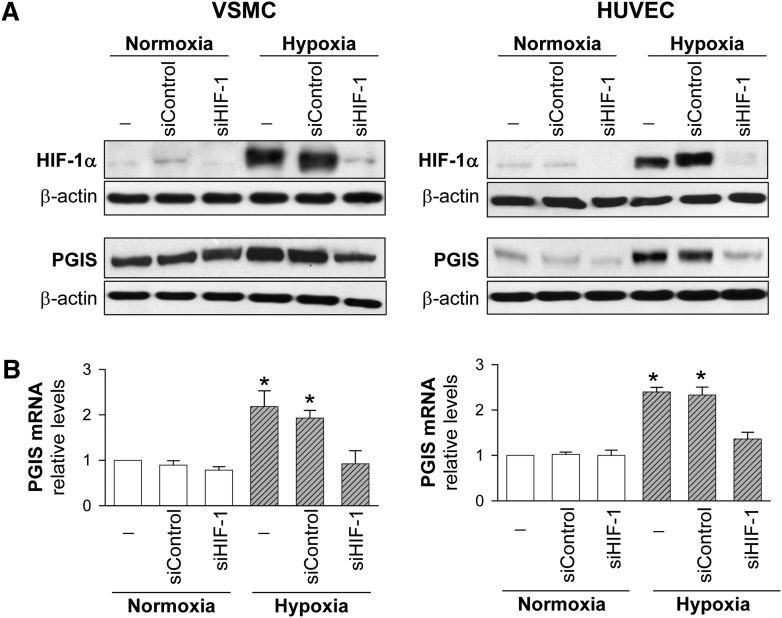
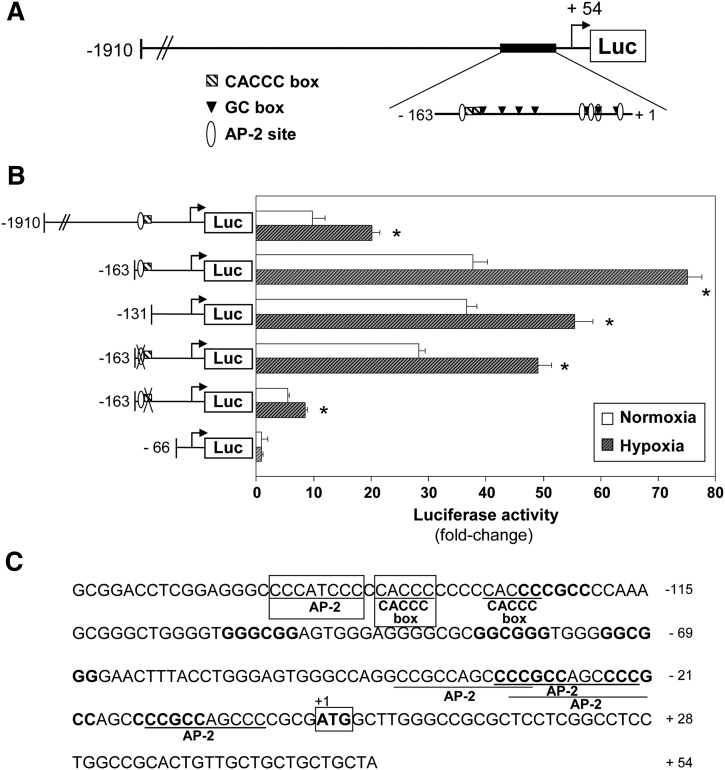
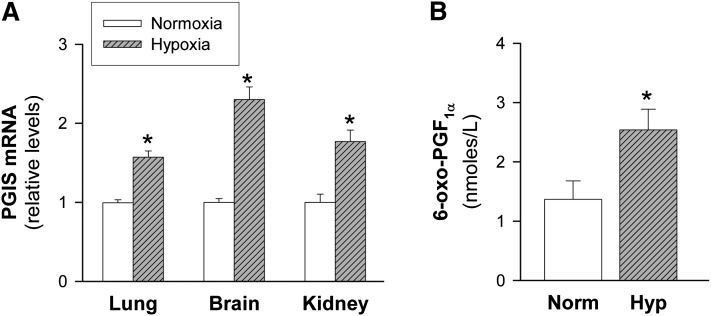
Hypoxia affects vascular function and cell metabolism, survival, growth, and motility; these processes are partially regulated by prostanoids. We analyzed the effect of hypoxia and inflammation on key enzymes involved in prostanoid biosynthesis in human vascular cells. In human vascular smooth muscle cells (VSMC), hypoxia and interleukin (IL)-1β synergistically increased prostaglandin (PG)I₂ but not PGE₂ release, thereby increasing the PGI₂/PGE₂ ratio. Concomitantly, these stimuli upregulated cyclooxygenase-2 (COX-2) expression (mRNA and protein) and COX activity. Interestingly, hypoxia enhanced PGI-synthase (PGIS) expression and activity in VSMC and human endothelial cells. Hypoxia did not significantly modify the inducible microsomal-PGE-synthase (mPGES)-1. Hypoxia-inducible factor (HIF)-1α-silencing abrogated hypoxia-induced PGIS upregulation. PGIS transcriptional activity was enhanced by hypoxia; however, the minimal PGIS promoter responsive to hypoxia (-131 bp) did not contain any putative hypoxia response element (HRE), suggesting that HIF-1 does not directly drive PGIS transcription. Serial deletion and site-directed mutagenesis studies suggested several transcription factors participate cooperatively. Plasma levels of the stable metabolite of PGI₂ and PGIS expression in several tissues were also upregulated in mice exposed to hypoxia. These data suggest that PGIS upregulation is part of the adaptive response of vascular cells to hypoxic stress and could play a role in counteracting the deleterious effect of inflammatory stimuli.


Figures

Fig. 1.
Fig. 1.
Time course of prostanoid release by human VSMC as a function of the time of exposure to hypoxia. VSMC were cultured with/without IL-1β (50 U/ml) under normoxia or hypoxia for the indicated periods of time, and (A) PGI2 (measured as its stable metabolite 6-oxo-PGF, n = 8), (B) PGE2 (n = 8), (C) PGF (n = 4), and (D) TxA2 (measured as its stable metabolite TxB2, n = 4) were analyzed by EIA. Data are mean ± SEM. *P < 0.05 versus cells exposed to normoxia or hypoxia alone; #P < 0.05 versus cells exposed to normoxia, hypoxia alone, or treated with IL-1β alone. All comparisons refer to the same treatment time.
Fig. 2.
Fig. 2.
COX-2 expression and COX activity in human VSMC as a function of the time of exposure to hypoxia. VSMC were cultured with/without IL-1β (50 U/ml) under normoxia (N) or hypoxia (H) for the indicated periods of time. A: COX-2 mRNA levels were analyzed by real-time PCR and expressed relative to IL-1β-untreated cells in normoxia (Control) (n = 7). The top inset show the transient and early upregulation of COX-2 by hypoxia. B: COX-2 protein levels were analyzed by Western blot. A representative immunoblot is shown. Bar graph represents computer-assisted densitometry values normalized to Control (n = 6). C: COX activity was analyzed by incubating the cells with [1-14C]arachidonic acid as described (25, 28) (n = 5). Values are the mean ± SEM. *P < 0.05 versus cells exposed to normoxia; #P < 0.05 versus cells exposed to normoxia or hypoxia alone; P < 0.05 versus cells exposed to normoxia, hypoxia alone, or IL-1β alone. All comparisons refer to the same treatment time.
Fig. 3.
Fig. 3.
PGIS expression and activity in human VSMC as a function of the time of exposure to hypoxia. VSMC were cultured with/without IL-1β (50 U/ml) under normoxia (N) or hypoxia (H) for the indicated periods of time. A: PGIS mRNA levels were analyzed by real-time PCR and expressed relative to IL-1β-untreated cells in normoxia (Control) (n = 5). B: PGIS protein levels were analyzed by Western blot. A representative immunoblot is shown. Bar graph represents computer-assisted densitometry values normalized to Control (n = 5). C: PGIS activity was analyzed by incubating the cells with [1-14C]PGH2 as described (25) (n = 4). Values are the mean ± SEM. *P < 0.05 versus cells exposed to normoxia or IL-1β alone. All comparisons refer to the same treatment time.
Fig. 4.
Fig. 4.
mPGES-1 expression in human VSMC as a function of the time of exposure to hypoxia. VSMC were cultured with/without IL-1β (50 U/ml) under normoxia (N) or hypoxia (H) for the indicated periods of time. A: mPGES-1 mRNA levels were analyzed by real-time PCR and expressed relative to IL-1β-untreated cells in normoxia (Control) (n = 7). B: mPGES-1 protein levels were analyzed by Western blot. A representative immunoblot is shown. Bar graph represents computer-assisted densitometry values normalized to Control (n = 7). Values are the mean ± SEM. *P < 0.05 versus cells exposed to normoxia or hypoxia alone. All comparisons refer to the same treatment time.
Fig. 5.
Fig. 5.
PGIS expression and activity in HUVEC as a function of the time of exposure to hypoxia. HUVEC were cultured with/without IL-1β (10 U/ml) under normoxia (N) or hypoxia (H) for the indicated periods of time. A: PGIS mRNA levels were analyzed by real-time PCR and expressed relative to IL-1β-untreated cells in normoxia (Control) (n = 5). B: PGIS protein levels were analyzed by Western blot. A representative immunoblot is shown. Bar graph represents computer-assisted densitometry values normalized to Control (n = 5). C: PGIS activity was analyzed as indicated in methods (n = 4). Values are the mean ± SEM. *P < 0.05 when compared with normoxia or IL-1β alone.
Fig. 6.
Fig. 6.
Effect of hypoxia and IL-1β on tyrosine nitration of PGIS in HUVEC. Cells were cultured with/without IL-1β (10 U/ml) under normoxia (N) or hypoxia (H) for 48 h and then PGIS nitration was evaluated in cell lysates. PGIS was immunoprecipitated with a polyclonal antibody against PGIS (IP: PGIS) and then Western blotted with a monoclonal antibody against 3-nitrotyrosine (WB: 3-NT). β-actin levels were analyzed in the input protein to assess that equal amounts of total protein were subjected to immunoprecipitation. A: Representative immunoblot analysis. B: Graphs corresponding to protein levels of nitrated PGIS represent computer-assisted densitometry values normalized to Control (n = 4). Values are the mean ± SEM. *P < 0.05 versus normoxia; P < 0.05 versus IL-1β alone.
Fig.7.
Fig.7.
Effect of HIF-1α knockdown on PGIS upregulation by hypoxia. VSMC and HUVEC were transfected with siRNA control (siControl) or siRNA against HIF-1α (siHIF-1), and then exposed to normoxia or hypoxia. Protein levels were analyzed by Western blot. A: Representative immunoblot analysis (one out of two) showing HIF-1α and PGIS protein levels in cells transfected with siControl or siHIF-1 and exposed to hypoxia for 6 h (HIF-1α protein levels) or 48 h (PGIS mRNA and protein levels). B: PGIS mRNA levels analyzed by real-time PCR in VSMC and HUVEC transfected with siControl or siHIF-1 and exposed to normoxia or hypoxia for 24 h (n = 4). Values are the mean ± SEM. *P < 0.05 compared with cells in normoxia or cells transfected with siHIF-1 and exposed to hypoxia.
Fig.8.
Fig.8.
Hypoxia induces PGIS expression through a transcriptional mechanism. A: Scheme showing the construct containing 1910 bp of PGIS promoter used in transfection experiments (pGL3/PGIS-1910). The locations of putative response elements in PGIS proximal promoter are indicated. B: HUVEC were transiently transfected with PGIS promoter constructs and maintained under normoxic (white bars) or exposed to hypoxia (shaded bars) for 18 h. Serial deletion studies were performed with different constructs named according to their length upstream of the translation-initiation site. Luciferase activity is expressed as fold-change using pGL3/PGIS-66 (in the absence of stimulus) as a reference value. Promoter activity of the pGL3/PGIS-163 construct mutated in the AP-2 site or in the CACCC box located at positions -146 and -137, respectively, is also shown. Results are the mean ± SEM (n = 9); *P < 0.05 compared with the same construct under normoxia. C: Nucleotide sequence corresponding to pGL3/PGIS-163. The translational initiation codon is numbered as +1. Putative AP-2 sites and CACCC boxes are underlined, and GC boxes are bolded.
Fig.9.
Fig.9.
PGIS expression in highly vascularized tissues and plasma levels of PGI2 in animals exposed to hypoxia. C57BL/6 mice were maintained under normoxia (Norm, n = 8) or exposed to hypoxia for 24 h (Hyp [10% O2], n = 8). A: Tissue PGIS mRNA levels in mice exposed to normoxia or hypoxia for 24 h were analyzed by real-time PCR. Data were normalized to 18S rRNA and expressed relative to normoxia. B: Levels of PGI2 (measured as its stable metabolite 6-oxo-PGF) in plasma were determined by EIA. Results are the mean ± SEM. *P < 0.05 versus normoxia.

References

    1. Semenza G. L., Agani F., Feldser D., Iyer N., Kotch L., Laughner E., Yu A. 2000. Hypoxia, HIF-1, and the pathophysiology of common human diseases. Adv. Exp. Med. Biol. 475: 123–130. - PubMed
    1. Semenza G. L. 2000. Surviving ischemia: adaptive responses mediated by hypoxia-inducible factor 1. J. Clin. Invest. 106: 809–812. - PMC - PubMed
    1. Silvestre J. S., Mallat Z., Tedgui A., Lévy B. I. 2008. Post-ischaemic neovascularization and inflammation. Cardiovasc. Res. 78: 242–249. - PubMed
    1. Schmedtje J. F., Jr.,, Ji Y. S., Liu W-L., DuBois R. N., Runge M. S. 1997. Hypoxia induces cyclooxygenase-2 via the NF-kappaB p65 transcription factor in human vascular endothelial cells. J. Biol. Chem. 272: 601–608. - PubMed
    1. Xu Q., Ji Y. S., Schmedtje J. F., Jr 2000. Sp1 increases expression of cyclooxygenase-2 in hypoxic vascular endothelium. Implications for the mechanisms of aortic aneurysm and heart failure. J. Biol. Chem. 275: 24583–24589. - PubMed

Publication types

MeSH terms

LinkOut - more resources