. 2011 Mar 15;186(6):3421-31.
doi: 10.4049/jimmunol.1000569. Epub 2011 Feb 4.

Involvement of CD226+ NK cells in immunopathogenesis of systemic lupus erythematosus

Affiliations

Involvement of CD226+ NK cells in immunopathogenesis of systemic lupus erythematosus

Zhan Huang et al. J Immunol. .

Abstract

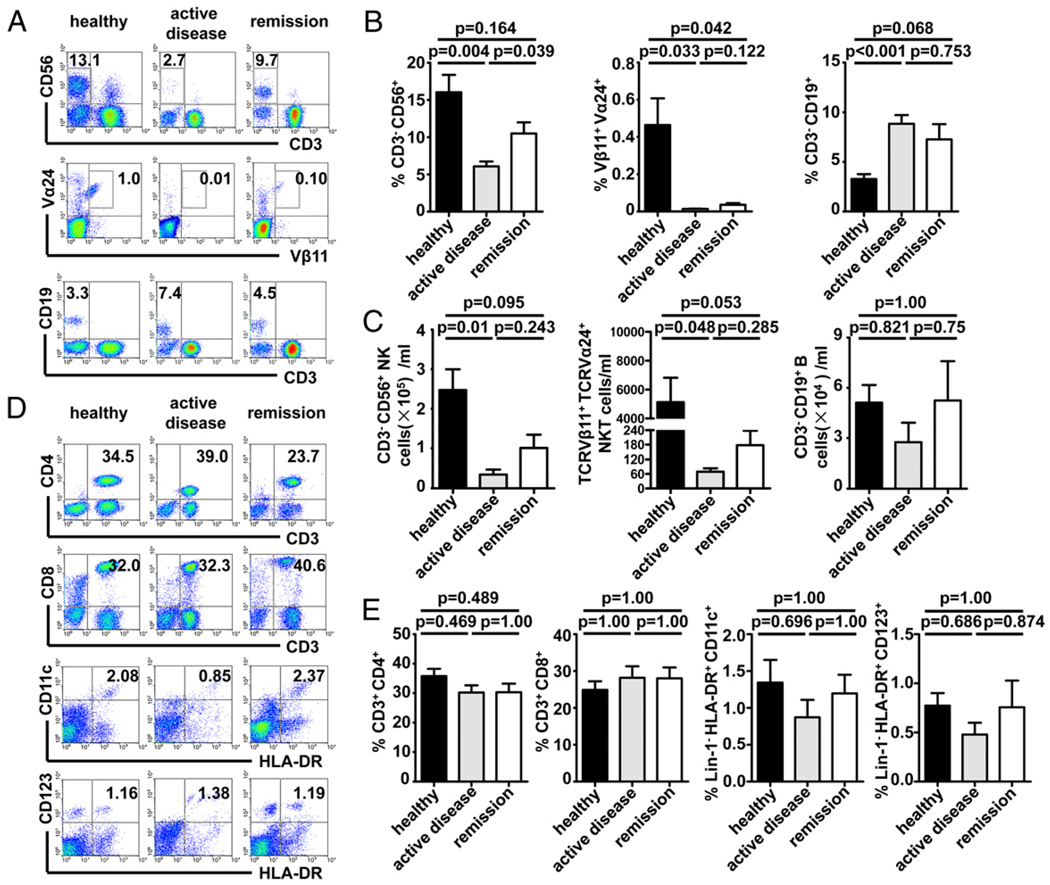
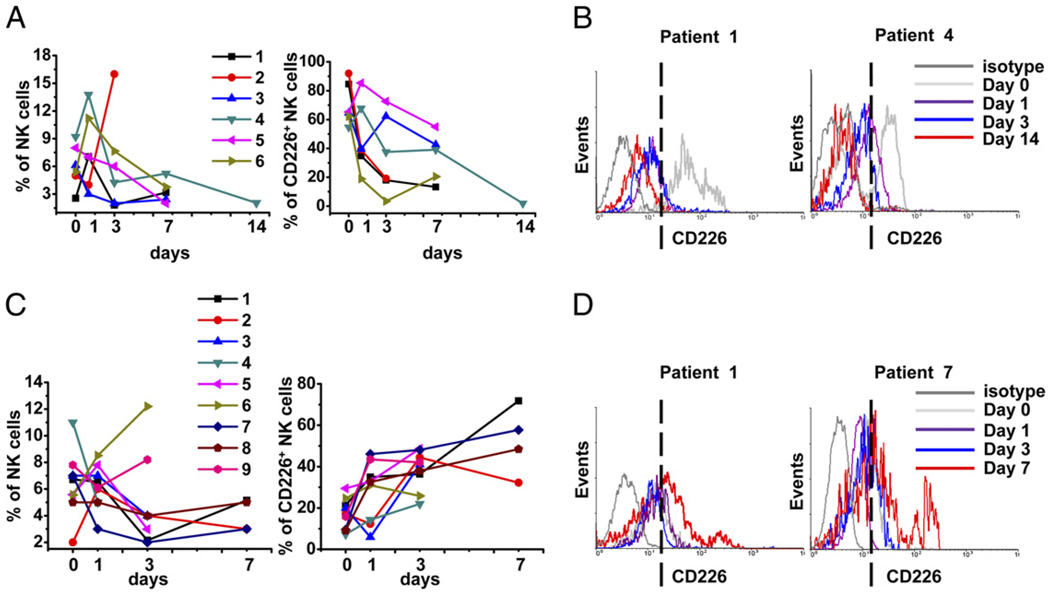
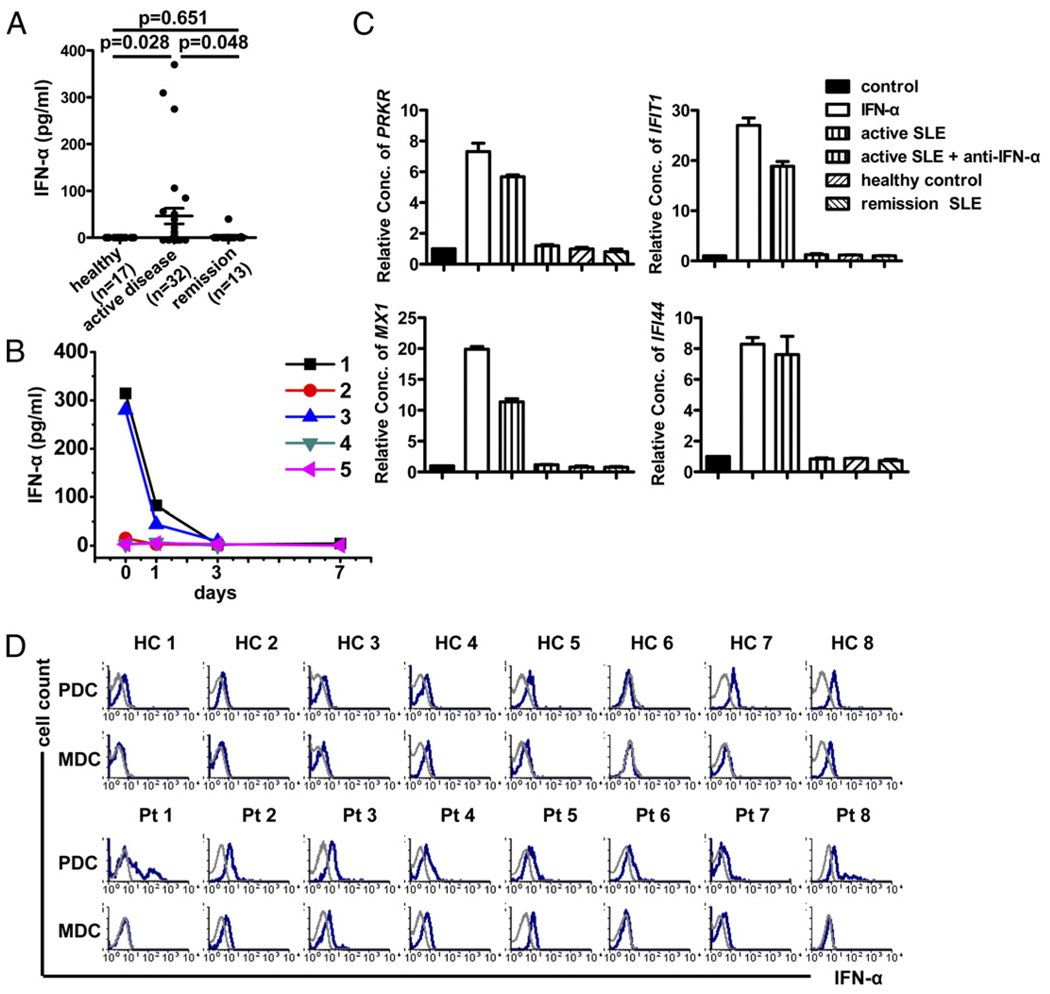
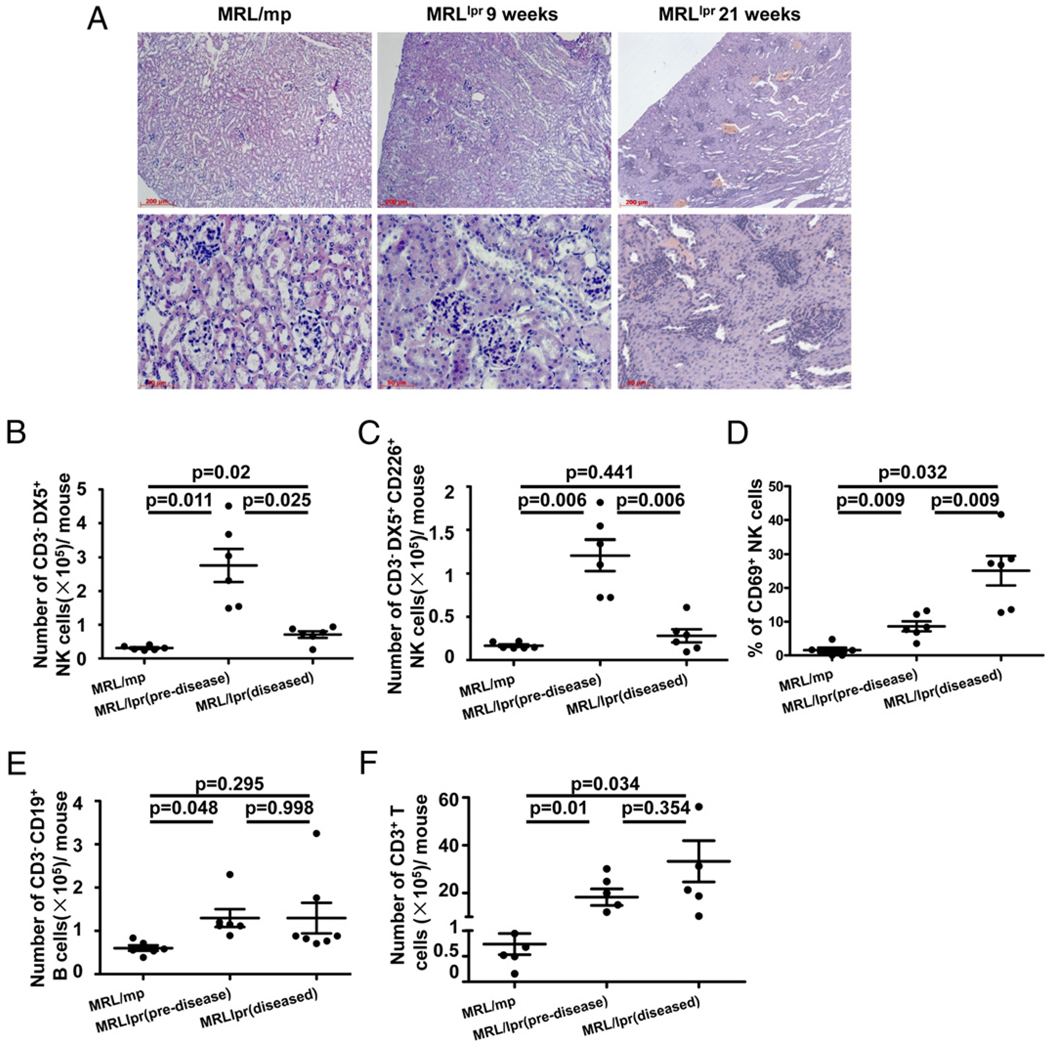
Dysfunction of immune systems, including innate and adaptive immunity, is responsible for the immunopathogenesis of systemic lupus erythematosus (SLE). NK cells are a major part of the innate immune system, and diminished populations of NK cells have been reported in SLE patients. However, the mechanisms behind this decrease and the role of NK cells in SLE pathogenesis remain poorly understood. In this study, we found that a deficiency of NK cells, especially CD226(+) NK cells, is prominent in patients with active SLE. Meanwhile, expression of the CD226 ligands CD112 and CD155 on plasmacytoid dendritic cells is observed in SLE patients; thus, activation of CD226(+) NK cells may be induced by CD226-ligand interactions. Furthermore, IFN-α, which is mainly produced by plasmacytoid dendritic cells, can mediate the activation-induced cell death of NK cells. Therefore, these processes likely contribute to the loss of NK cells in patients with active SLE. Despite the impaired cytotoxicity of peripheral NK cells in human SLE patients and mouse SLE models, we provide evidence that CD226(+) NK cells infiltrate the kidneys of predisease MRL-lpr/lpr mice. Kidney-infiltrating NK cells displayed an activated phenotype and a marked ability to produce cytotoxic granules. These results suggest that, before apoptosis, activated NK cells can infiltrate tissues and, to some extent, mediate tissue injury by producing cytotoxic granules and immunoregulatory cytokines.


Conflict of interest statement

Disclosures

The authors have no financial conflicts of interest.

Figures

FIGURE 1
FIGURE 1
The frequency of NK cells is reduced in SLE patients with active disease. Freshly isolated PBMCs were stained with anti-CD3, CD11c, CD19, CD56, Vα24, and Vβ11 mAbs and analyzed by flow cytometry. A and D, The relative percentages of NK cells, NKT cells, B cells, CD4+ T cells, CD8+ T, MDCs, and PDCs were analyzed. Representative examples are shown from healthy controls, active SLE, and SLE in remission. C, Numbers of NK cells, NKT cells, and B cells/ml in blood. B and E, Subjects were categorized into groups determined by their SLEDAI. Mean (± SEM) proportion of NK cells, NKT cells, B cells, CD4+ T cells, CD8+ T cells, MDCs, and PDCs are shown for each group. Significance was determined using one-way ANOVA, followed by the Bonferroni post hoc test.
FIGURE 2
FIGURE 2
Downregulated expression of CD226 on NK cells from SLE patients and MRL/lpr mice with active disease. Freshly isolated PBMCs were stained with anti-CD3, CD56, and CD226 mAbs. A, NK cells were gated (top panel), and expression of CD226 was analyzed (bottom panel) on NK cells from healthy controls, patients with active SLE, and patients in remission. B, Cumulative data are shown for the mean (± SEM) proportion of CD226+ NK cells of healthy controls, patients with active SLE, and patients with SLE in remission. Significance was determined using oneway ANOVA, followed by the Bonferroni post hoc test. C, Freshly isolated mouse splenic lymphocytes were stained with anti-CD3, DX5, and CD226 mAbs. Representative flow cytometric dot plots show the proportion of NK cells (top panel) and the expression of CD226 on NK cells (bottom panel) in an MRL/mp mouse, a diseased MRL/lpr mouse, and a predisease MRL/lpr mouse. D, Cumulative data are shown for the mean (± SEM) proportion of CD226+ NK cells of MRL/mp mice, diseased MRL/lpr mice, and predisease MRL/lpr mice. Significance was determined using one-way ANOVA, followed by the Bonferroni post hoc test.
FIGURE 3
FIGURE 3
Dynamic investigation of CD226+ NK cells in SLE patients during therapy. PBMCs were isolated from SLE patients during therapy on the indicated days. A, Proportion of NK cells detected in six patients during the exacerbation stage (left panel). Percentage of CD226+ NK cells of total NK cells in the same six patients (right panel). B, Two representative examples (Patient 1 and Patient 4) are shown from six independent patients; CD3CD56+ cells were gated, and the percentage of CD226+ NK cells was analyzed. C, Proportion of NK cells in nine patients during remission (left panel). Percentage of CD226+ NK cells of total NK cells in the same nine patients (right panel). D, Two representative examples (Patient 1 and Patient 7) are shown from nine independent patients; CD3CD56+ cells were gated, and the percentage of CD226+ NK cells was analyzed. The dashed vertical lines indicate the proportion of CD226+ NK cells at the end of treatment.
FIGURE 4
FIGURE 4
Expression of CD112 and CD155 on DCs in SLE patients. Expression of the CD226 ligands CD112 (A) and CD155 (C) was measured by flow cytometry. Expression of the indicated ligands (blue graphs) relative to isotype-matched controls (gray graphs) on T cells, B cells, MDCs, and PDCs was examined. B and D, As in A and C, respectively, cumulative data (mean ± SEM) from CD112+ cells and CD155+ cells in the four cell types are shown.
FIGURE 5
FIGURE 5
IFN-α level is elevated in plasma from SLE patients with active disease. A, Plasma level of IFN-α in healthy donors, active SLE, and SLE in remission was quantified by sandwich ELISA. Significance was determined using one-way ANOVA, followed by the Bonferroni post hoc test. B, Plasma was obtained from five SLE patients during therapy, and levels of IFN-α were determined by ELISA. C, To test plasma for functional IFN-α activity, PBMCs from healthy controls were stimulated with IFN-α, plasma from healthy controls or SLE in remission, or plasma from active SLE with or without IFN-α–neutralizing Ab. Relative expression of IFN-α–regulated genes (PRKR, IFIT1, MX1, and IFI44) compared with no stimulation in three independent experiments (mean ± SEM). D, Expression of IFN-α (blue graphs) relative to isotype-matched controls (gray graphs) in MDCs and PDCs obtained from healthy controls and SLE patients was measured by flow cytometry.
FIGURE 6
FIGURE 6
IFN-α or SLE patient plasma activates NK cells from healthy controls in vitro. A, Freshly isolated PBMCs from healthy controls were stimulated with IL-2 (100 U/ml) and then IFN-α (1000 U/ml) or IL-2 (100 U/ml) plus IFN-α (1000 U/ml). Cultured cells were harvested at the indicated time points and analyzed. The ratios of CD69+ NK cells (left panel), CD226+CD69+ NK cells (middle panel), and CD226CD69+ NK cells (right panel) were analyzed by flow cytometry. One representative example from three independent experiments is shown. B, PBMCs from healthy controls were cultured with medium or four types of plasma, including the plasma from healthy controls, from SLE patients in remission, from active SLE patients, and from active SLE patients with IFN-α–neutralizing Ab. For each type of plasma, three independent samples were adopted repeatedly. Cultured cells were harvested and analyzed as in A. Data are shown as mean ± SEM from three independent experiments. Significance was determined using one-way ANOVA, followed by the Bonferroni post hoc test.
FIGURE 7
FIGURE 7
Determination of CD226 expression and apoptosis of NK cells after stimulation with IFN-α or SLE patient plasma. A and B, To determine the expression of CD226 on NK cells and detect apoptotic NK cells after stimulation with IFN-α, freshly isolated PBMCs from healthy controls were stimulated with medium or IL-2 and then IFN-α or IL-2 plus IFN-α. Cultured cells were harvested at the indicated time points and analyzed by flow cytometry. One representative example from three independent experiments is shown. PBMCs and purified CD226+ and CD226 NK cells from healthy controls were cultured with medium or four types of plasma, including the plasma from healthy controls, from SLE patients in remission, from active SLE patients, and from active SLE patients with IFN-α–neutralizing Ab. For each type of plasma, three independent samples were adopted repeatedly. The proportion of CD226+ NK cells (C) and apoptosis of CD226+ NK cells (D) and CD226 NK cells (E) were analyzed by flow cytometry. Data are shown as mean ± SEM from three independent experiments. Significance was determined using one-way ANOVA, followed by the Bonferroni post hoc test.
FIGURE 8
FIGURE 8
Enrichment of NK cell numbers in the kidneys of MRL/lpr mice. A, Representative kidney sections stained with H&E from an MRL/mp mouse, a 9-wk-old MRL/lpr mouse, and a 21-wk-old MRL/lpr mouse. At the time of sacrifice, the kidneys were removed and sectioned before staining with H&E (original magnification ×100 [top row] and ×400 [bottom row]). Kidney MNCs were obtained from MRL/mp and predisease and diseased MRL/lpr mice. Absolute numbers of NK cells (B), CD226+ NK cells (C), B cells (E), and T cells (F) were calculated as detailed in Materials and Methods. Results are expressed as the number of cells per two kidneys. D, NK cells from kidney MNCs in MRL/mp and predisease and diseased MRL/lpr mice were assayed ex vivo for CD69 expression. Results are expressed as the mean ± SEM for each group. Significance was determined using one-way ANOVA, followed by the Bonferroni post hoc test.
FIGURE 9
FIGURE 9
Cytotoxic granule and cytokine production by kidney-infiltrating NK cells in MRL/lpr mice. Kidney MNCs isolated from MRL/mp and predisease and diseased MRL/lpr mice were stimulated with PMA + ionomycin for 4 h. A, Representative graphs show IFN-γ, granzyme B, and perforin expressed by kidney NK cells in MRL/mp and predisease and diseased MRL/lpr mice. B, Statistical analysis of the expression of IFN-γ, granzyme B, and perforin in NK cells from MRL/mp and predisease and diseased MRL/lpr mice; means ± SEM are displayed. Significance was determined using one-way ANOVA, followed by the Bonferroni post hoc test.

References

    1. Mills JA. Systemic lupus erythematosus. N. Engl. J. Med. 1994;330:1871–1879. - PubMed
    1. Pisetsky DS, Rönnblom L. Systemic lupus erythematosus: a matter of life and death. Arthritis Rheum. 2009;60:1567–1570. - PubMed
    1. Wakeland EK, Liu K, Graham RR, Behrens TW. Delineating the genetic basis of systemic lupus erythematosus. Immunity. 2001;15:397–408. - PubMed
    1. Hess EV. Environmental lupus syndromes. Br. J. Rheumatol. 1995;34:597–599. - PubMed
    1. Chen C, Prak EL, Weigert M. Editing disease-associated auto-antibodies. Immunity. 1997;6:97–105. - PubMed

Publication types

MeSH terms

Substances