. 2011 Apr 7;117(14):e109-19.
doi: 10.1182/blood-2010-07-298331. Epub 2011 Feb 4.

Efficient generation of transgene-free induced pluripotent stem cells from normal and neoplastic bone marrow and cord blood mononuclear cells

Affiliations

Efficient generation of transgene-free induced pluripotent stem cells from normal and neoplastic bone marrow and cord blood mononuclear cells

Kejin Hu et al. Blood. .

Abstract

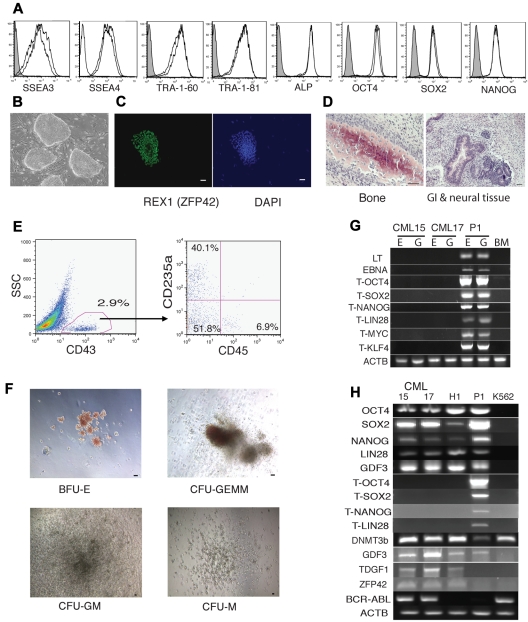
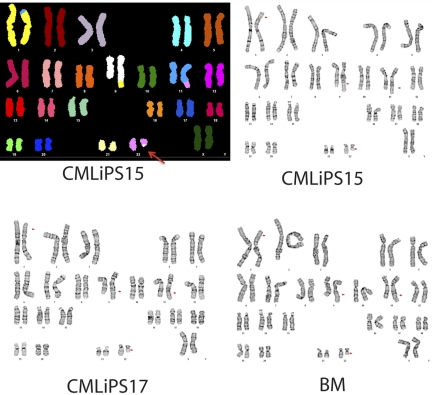
Reprogramming blood cells to induced pluripotent stem cells (iPSCs) provides a novel tool for modeling blood diseases in vitro. However, the well-known limitations of current reprogramming technologies include low efficiency, slow kinetics, and transgene integration and residual expression. In the present study, we have demonstrated that iPSCs free of transgene and vector sequences could be generated from human BM and CB mononuclear cells using non-integrating episomal vectors. The reprogramming described here is up to 100 times more efficient, occurs 1-3 weeks faster compared with the reprogramming of fibroblasts, and does not require isolation of progenitors or multiple rounds of transfection. Blood-derived iPSC lines lacked rearrangements of IGH and TCR, indicating that their origin is non-B- or non-T-lymphoid cells. When cocultured on OP9, blood-derived iPSCs could be differentiated back to the blood cells, albeit with lower efficiency compared to fibroblast-derived iPSCs. We also generated transgene-free iPSCs from the BM of a patient with chronic myeloid leukemia (CML). CML iPSCs showed a unique complex chromosomal translocation identified in marrow sample while displaying typical embryonic stem cell phenotype and pluripotent differentiation potential. This approach provides an opportunity to explore banked normal and diseased CB and BM samples without the limitations associated with virus-based methods.


Figures

Figure 1
Figure 1
Efficient generation of transgene-free iPSCs from BM mononuclear cells. (A) Schematic diagram of reprogramming protocol. (B) Kinetics of morphologic changes after blood reprogramming. (C-D) Comparison of reprogramming efficiency between blood cells and fibroblasts. (C) Left graph shows the numbers of ALP+ colonies per 1 million BM cells and fibroblasts (FB) transfected side by side with combination 19 episomal vectors. Two independent experiments, E2 and E3, are shown. Right panel shows ALP staining of colonies generated after transfection and the first passage on MEFs 2 × 10⁵ BM cells (top) and 3.3 × 10⁵ fibroblasts (bottom). (D) Expandable iPSC colonies obtained from 1 million FB and BM cells transfected with the same set of reprogramming factors. Black bar shows the number of iPSC colonies generated from foreskin fibroblasts in our previous studies. Bars in E1 and E4 show results of reprogramming of BM mononuclear cells from 2 independent experiments (E1 and E4). (E) Flow cytometric analysis of hESC-specific marker expression in 7 BM iPSC lines and 6 subclones generated from BM iPSC1. (F) Representative immunofluorescent staining of BM iPSCs with REX1 antibody. Bar indicates 50 μm. (G) H&E staining of teratoma from representative BM iPSC line (BM iPSC1M). Neuronal rosette and gastro-intestine-like structure can be seen in the left panel. Cartilage and gut epithelium can be seen in the right panel. Bars indicate 50 μm. (H) Normal karyogram representative of BM iPSC (BM iPSC1M). (I) PCR analysis of episomal and genomic DNA in subclones I-N obtained from the BM iPSC1 line. Human BM genomic DNA serves as negative control (BM), whereas DNA samples from human BM mononuclear cells transfected with the same constructs are used as a positive control (P1). T indicates that transgene specific primers were used. (J) RT-PCR analysis of expression of transgenes and endogenous pluripotency genes in subclones I-N obtained from the BM iPSC1 line. The T series of primers are transgene-specific. Negative controls (BM) are results of untransfected BM RNA. Positive controls (P1) are BM cells transfected with the same reprogramming plasmids. (K) Progressive loss of episomal plasmid from BM iPSC lines. Ten randomly selected BM iPSC lines (1-3, 7-9, 16-18, and 21) were analyzed. Vector-specific primer pairs (EBNA, middle panel) were used to examine the episomal DNA from different passages (passage 3, 4, 5, and 7) of the BM iPSC lines. Samples of passage 7 were further examined by other transgene-specific primers (right panel). Left panel shows existence of genomic DNA (human actin genomic primers) in the episomal DNA extracted using the previously published method.
Figure 2
Figure 2
Global analysis of gene expression in hESCs and iPSCs generated from BM, CB, and fibroblasts and their parental cells. (A) Pearson correlation analysis of global gene expression. (B) Scatter plots comparing the global gene-expression profiles of BM9 iPSC line with H9 hESCs (left) and parental BM cells (right). Pearson correlation coefficient (R) is shown in top left corner. The transcript expression levels are shown on a log2 scale. (C) Heat maps demonstrate the expression of hESC, fibroblast, and BM hematopoietic cell-enriched genes. Yellow lines outline major clusters shown in panel A.
Figure 3
Figure 3
Reprogramming of CB mononuclear cells with nonintegrating constructs. (A) All 22 CB iPSC lines express hESC-specific surface markers as indicated, and express OCT4, NANOG, and SOX2. iPSC lines checked are: CB iPSC1 to CB iPSC6, CB iPSCT1 to CB iPSCT10, CB iPSCT12 to CB iPSCT16, and CB iPSCND. (B) Thiazovivin (T+) promotes reprogramming of CB mononuclear cells. The numbers of iPSC lines generated from 1.7 × 10⁶ transfected CB mononuclear cells are shown. (C) Normal karyogram of the CB iPSC6 line. (D) H&E staining of representative terotoma from CB iPSCs with derivatives of 3 germ layers. (E-G) CB iPSCs cells are free of transgene and episomal DNA. Episomal DNA (E) and genomic DNA (F) were prepared from CB iPSC lines of CB iPSC1, CB iPSC6, and CB iPSCT3, -4, -7, -8, and -9. RT-PCR analysis of expression of transgenes and endogenous pluripotency genes. T-transgene–specific primers were used as indicated.
Figure 4
Figure 4
Hematopoietic differentiation potential of BM- and CB-derived iPSCs. (A) In coculture with OP9, blood-derived iPSCs generate a CD34+ population of cells with typical subsets including CD43+ hematopoietic progenitors, CD31+CD43 endothelial cells, and CD31CD43 mesenchymal cells. The CD43+ population of hematopoietic cells consists of CD235a+CD41a+/− erythro-megakaryocytic progenitors and CD235a/CD41aCD45+/− multipotent progenitors. The representative experiment shows hematopoietic subsets generated from the BM iPSC1 line. (B) Percentage of CD43+ hematopoietic cells generated from hESC H1, fibroblast (DF), and blood-derived (BM, CB) iPSC lines after 8 days of coculture with OP9.
Figure 5
Figure 5
Analyses of TCR and IGH rearrangement in BM and CB iPSC lines. (A) PCR analyses of TCRB rearrangements. (B) PCR analyses of TCRG rearrangement. (C) PCR analyses of IGH rearrangements. FR indicates framework. (D) Specimen controls. M indicates the 50-bp DNA ladder; H2O, no template control; H1, genomic DNA from hESC H1 (negative control). Eleven iPSC lines were examined as indicated. IVS-0000 is a polyclonal control DNA; IVS-0009, IVS-0004, IVS-0021, IVS-0030, and IVS-0029 are clonal control DNAs.
Figure 6
Figure 6
Generation of iPSCs from BM samples from a patient in the chronic phase of CML. (A) Flow cytometric analysis of hESC-specific marker expression in CML iPSC15 and CML iPSC17. (B) Bright-field image demonstrating typical hESC morphology of CML iPSCs growing on MEFs. (C) Representative immunofluorescent staining of CML iPSCs with REX1 antibody. Bar indicates 50 μm. (D) Representative H&E staining of teratoma generated from CMLiPS15 showing derivatives of 3 germ layers as indicated in each of the panels. (E) Flow cytometric demonstration of differentiation of CMLiPS15 into blood cells in OP9 coculture. (F) Colony-forming unit assay from blood progenitor cells differentiated from line CML iPSC15. BFU-E indicates burst-forming unit-erythroid; CFU-GEMM; colony-forming unit-granulocyte, erythrocyte, monocyte, and megakaryocyte; CFU-M, colony-forming unit-macrophage; CFU-GM, colony-forming unit-granulocyte and monocyte. (G) CML iPSC lines 15 and 17 are free of transgene and vector sequence; E indicates the episomal fraction and G the genomic fraction of DNA; BM, human BM genomic DNA; P1, human BM mononuclear cells transfected with identical constructs. The T series of primers are transgene specific. ACTB indicates human actin primers that were used to check the DNA quality. (H) CML iPSCs express pluripotent genes, but not the corresponding transgenes. P1 indicates human BM mononuclear cells transfected with identical constructs. The hESC line H1 is the positive control and the Philadelphia chromosome-positive line K562 is used as the negative control for pluripotency, but as a positive control for the BCR-ABL fusion gene.
Figure 7
Figure 7
Karyograms of BM cells from a patient with CML and the 2 iPSCs derived from these cells. Top left panel shows spectral karyogram of CML iPSC15. SKY analysis demonstrates the 4-way translocation between chromosomes 1, 9, 11, and 22, shown here by classification-colored metaphase chromosomes. Translocations are apparent by the different colors of translocated segments representing the chromosome of origin. The Philadelphia chromosome is indicated by the red arrow. Standard G-banded karyotyping (top right and bottom panels) shows the complex 4-way translocation t(1;9;22;11)(p34.1;q34;q11.2;q23) found in all cells examined from the BM and from both iPSC lines (CML iPSC). The translocation 9;22 breakpoints of the BCR/ABL fusion are embedded in this rearrangement.

References

    1. Takahashi K, Tanabe K, Ohnuki M, et al. Induction of pluripotent stem cells from adult human fibroblasts by defined factors. Cell. 2007;131(5):861–872. - PubMed
    1. Yu J, Vodyanik MA, Smuga-Otto K, et al. Induced pluripotent stem cell lines derived from human somatic cells. Science. 2007;318(5858):1917–1920. - PubMed
    1. Loh YH, Agarwal S, Park IH, et al. Generation of induced pluripotent stem cells from human blood. Blood. 2009;113(22):5476–5479. - PMC - PubMed
    1. Ye Z, Zhan H, Mali P, et al. Human induced pluripotent stem cells from blood cells of healthy donors and patients with acquired blood disorders. Blood. 2009;114(27):5473–5480. - PMC - PubMed
    1. Staerk J, Dawlaty MM, Gao Q, et al. Reprogramming of human peripheral blood cells to induced pluripotent stem cells. Cell Stem Cell. 2010;7(1):20–24. - PMC - PubMed

Publication types

MeSH terms