. 2011 Apr;13(4):447-55.
doi: 10.1093/neuonc/noq197. Epub 2011 Feb 4.

MR diffusion tensor and perfusion-weighted imaging in preoperative grading of supratentorial nonenhancing gliomas

Affiliations

MR diffusion tensor and perfusion-weighted imaging in preoperative grading of supratentorial nonenhancing gliomas

Xiang Liu et al. Neuro Oncol. 2011 Apr.

Abstract

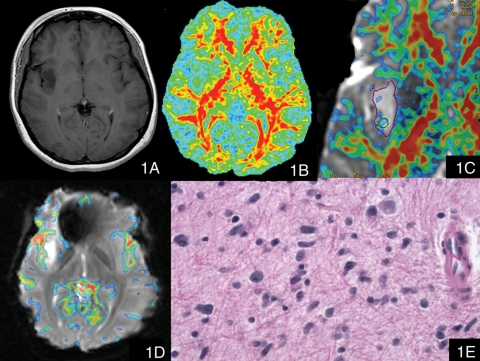
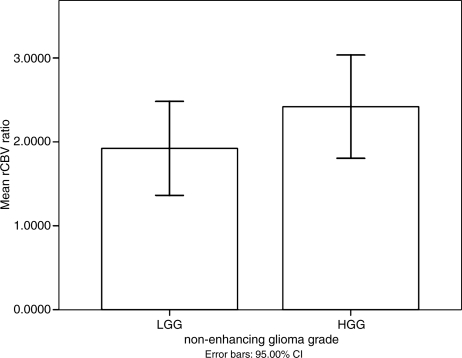
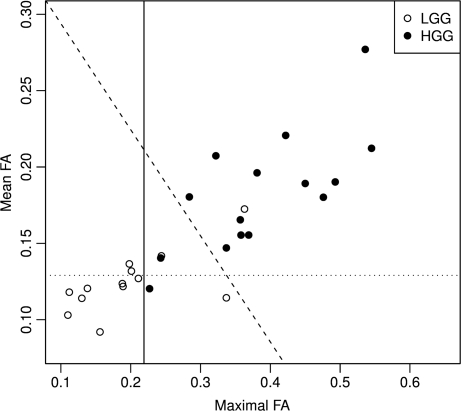
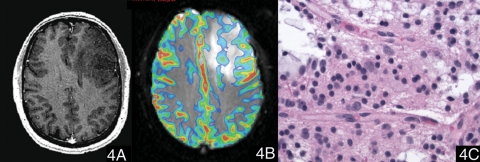
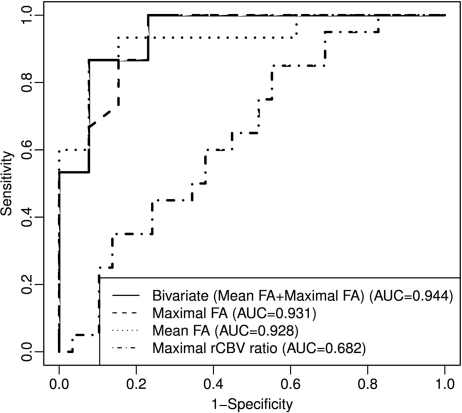
We evaluate the value of MR diffusion tensor imaging (DTI) and dynamic susceptibility-weighted contrast material-enhanced perfusion-weighted imaging (PWI) in preoperative grading of supratentorial nonenhancing gliomas. This institutional review board-approved, Health Insurance Portability and Accountability Act-compliant retrospective study involved 52 patients: 37 with low-grade gliomas (LGGs) and 15 with high-grade gliomas (HGGs). The mean trace apparent diffusion coefficient (ADC), minimal ADC, mean fractional anisotropy (FA), maximal FA, and maximal relative cerebral blood volume (rCBV) ratio of the lesions were measured and compared between LGG and HGG. The efficacy of the above parameters in grading supratentorial nonenhancing gliomas was evaluated. There was no significant difference in rCBV ratio, minimal ADC, and mean ADC between LGG and HGG (p > 0.05). The mean and maximal FA values of LGG were significantly lower than the values of HGG (p < 0.001). The receiver operating characteristic analysis showed that the mean FA with a cutoff value of 0.129 and the maximal FA with a cutoff value of 0.219 could differentiate between LGG and HGG with specificity of 69.2% and 76.9%, respectively, and sensitivity of 93.3% and 100.0%, respectively. The combination of mean FA and maximal FA based on the linear discriminant analysis improved the diagnostic accuracy with specificity of 92.3% and sensitivity of 86.7%. These findings were better than maximal rCBV ratio, mean ADC, and minimum ADC. The mean FA and maximal FA, used individually or combined, may be useful in preoperative grading of supratentorial nonenhancing gliomas.


Figures

Fig. 1.
Fig. 1.
A patient with anaplastic astrocytoma (WHO grade III). (1A) Postcontrast T1-weighted image showed a nonenhancing lesion in the right insular lobe. (1B) The contours and margins of the tumor could not be adequately visualized on the conventional dimensionless color FA image (FA scale range 0 to 0.6). (1C) The zoomed dimensionless FA color map was overlaid on the T2*-weighted (b = 0) image with the minimal FA value elevated to 0.215; this overlaid color image clearly showed the nodules with FA values larger than 0.215 within the tumor. (1D) The color maximal rCBV image overlaid on the T2*-weighted image (transverse gradient-echo dynamic susceptibility-weighted perfusion contrast-enhanced MR image) showed that there was no significant increased rCBV within the tumor (the maximal rCBV ratio value was 0.87). (1E) Hematoxylin and eosin, 400×, Infiltrating neoplastic cells have angulated elongated hyperchromatic nuclei.
Fig. 2.
Fig. 2.
The mean value plot of maximal rCBV ratio in nonenhancing LGG and HGG. There was no significant difference of mean values of maximal rCBV ratio between nonenhancing LGG and HGG. The error bars represent a 95% confidence interval.
Fig. 3.
Fig. 3.
Scatter plot of maximal FA and mean FA in nonenhancing LGG and HGG with discriminant lines. The vertical line represents cutoff value = 0.219 for maximal FA. The horizontal line represents cutoff value = 0.129 for mean FA. The oblique line represents cutoff value = 0.0 for the linear discriminant score (bivariate(mean FA + maximal FA)), which separates LGG from HGG better than either maximal FA or mean FA alone.
Fig. 4.
Fig. 4.
A case of oligodendroglioma (WHO grade II). (4A) Postcontrast T1-weighted image showed a nonenhancing lesion in the left frontal lobe. (4B) The color maximal rCBV image overlaid on the T2*-weighted image (transverse gradient-echo dynamic susceptibility-weighted perfusion contrast-enhanced MR image) showed that the maximal rCBV ratio of the tumor was 2.02. (4C) Hematoxylin and eosin, 400×, neoplastic cells show round nuclei and a network of thin capillaries.
Fig. 5.
Fig. 5.
A case of astrocytoma (WHO grade II). (5A) Postcontrast T1-weighted image showed a nonenhancing lesion in right frontal lobe. (5B) The color maximal rCBV image overlaid on the T2*-weighted image (transverse gradient-echo dynamic susceptibility-weighted perfusion contrast-enhanced MR image) showed that there was no significant increased rCBV ratio within the tumor (the maximal rCBV ratio value was 0.88). (5C) The color FA map overlaid on the T2*-weighted (b = 0) image with the minimal FA of 0.215 showed that there was no evident voxels with FA values higher than 0.215. (5D) Hematoxylin and eosin, 400×, neoplastic cells have round nuclei without perinuclear clearing.
Fig. 6.
Fig. 6.
ROC curve for differentiation of LGG from HGG. Predictors: the linear discriminant score (bivariate(mean FA + maximal FA) on LDA method), maximal rCBV ratio, maximum FA value, and mean FA value.
Fig. 7.
Fig. 7.
A case with large mass involving the left insular, temporal, and frontal lobes. (7A) is a postcontrast T1-weighted image, which shows the nonenhancing lesion. (7B) The color maximal rCBV image overlaid on the T2*-weighted image (transverse gradient-echo dynamic susceptibility-weighted perfusion contrast-enhanced MR image) showed the maximal rCBV ratio of the tumor was 1.51, which might suggest an LGG. (7C) and (7D) The color FA maps overlaid on the T2*-weighted (b = 0) image with the minimal FA of 0.215 showed that there were multiple nodules with increased FA values higher than 0.215 (arrows) and the maximal FA was 0.357, which suggested HGG. (7E) The postcontrast T1-weighted image after biopsy, indicating that the biopsy area was posterior to the area with high FA values revealed on (7D). (7F) Hematoxylin and eosin, 400× of the specimen of the biopsy. The pathology diagnosis of the biopsy specimen was astrocytoma, WHO grade II, with atypical elongated nuclei but no mitotic activity. (7G) Immunohistochemical stain (400×) of the biopsy specimen showed a Ki-67 proliferation index of 5%. The patient was suggested conservative therapy because of the histopathological diagnosis of LGG; however, as the review of advanced MR images, including maximal FA information, suggested a higher grade of this tumor, the patient insisted on partial resection 1 month later without aggressive treatment. (7H) Postcontrast T1-weighted image showed the partial resection cavity. (7I) Hematoxylin and eosin, 400× of the specimen of the partial resection. The pathology diagnosis of the resection specimen was anaplastic astrocytoma, WHO grade III, with pleomorphic nuclei and a mitotic figure. This pathologic diagnosis was consistent with our preoperative evaluation. (7J) Immunohistochemical stain (400×) of the partial resection specimen showed a Ki-67 proliferation index of 7% in the resected neoplasm.

References

    1. Ginsberg LE, Fuller GN, Hashmi M, Leeds NE, Schomer DF. The significance of lack of MR contrast enhancement of supratentorial brain tumors in adults: Histopathological evaluation of a series. Surg Neurol. 1998;49:436–440. - PubMed
    1. Fan GG, Deng QL, Wu ZH, Guo QY. Usefulness of diffusion/perfusion-weighted MRI in patients with non-enhancing supratentorial brain gliomas: A valuable tool to predict tumour grading? Br J Radiol. 2006;79:652–658. - PubMed
    1. White ML, Zhang Y, Kirby P, Ryken TC. Can tumor contrast enhancement be used as a criterion for differentiating tumor grades of oligodendrogliomas? AJNR Am J Neuroradiol. 2005;26:784–790. - PMC - PubMed
    1. Maia AC, Jr, Malheiros SM, da Rocha AJ, et al. MR cerebral blood volume maps correlated with vascular endothelial growth factor expression and tumor grade in nonenhancing gliomas. AJNR Am J Neuroradiol. 2005;26:777–783. - PMC - PubMed
    1. Mihara F, Numaguchi Y, Rothman M, Kristt D, Fiandaca M, Swallow L. Non-enhancing supratentorial malignant astrocytomas: MR features and possible mechanisms. Radiat Med. 1995;13:11–17. - PubMed