. 2011 Mar;134(Pt 3):665-77.
doi: 10.1093/brain/awq362. Epub 2011 Feb 4.

Locus coeruleus damage and noradrenaline reductions in multiple sclerosis and experimental autoimmune encephalomyelitis

Affiliations

Locus coeruleus damage and noradrenaline reductions in multiple sclerosis and experimental autoimmune encephalomyelitis

Paul E Polak et al. Brain. 2011 Mar.

Abstract

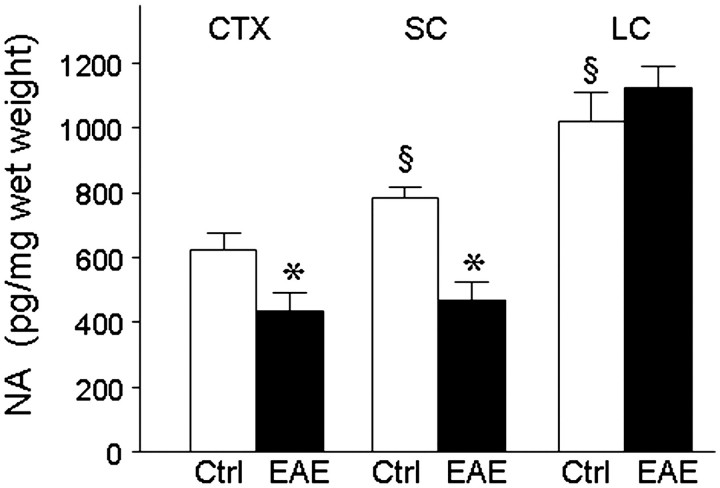
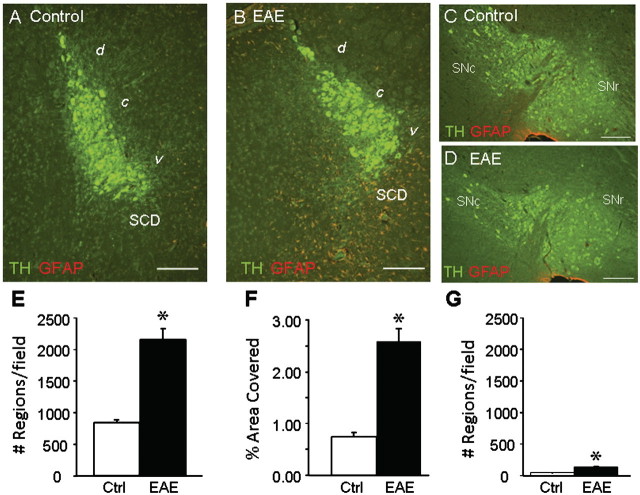
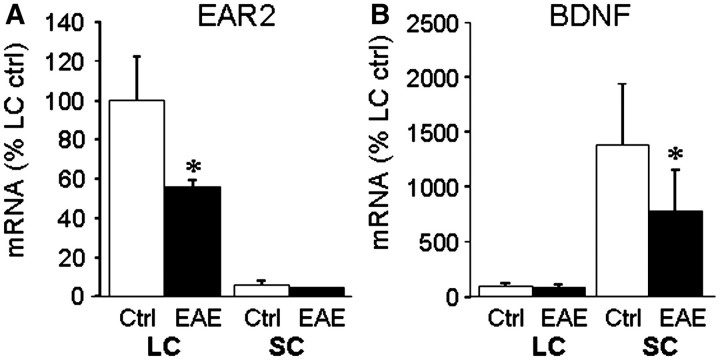
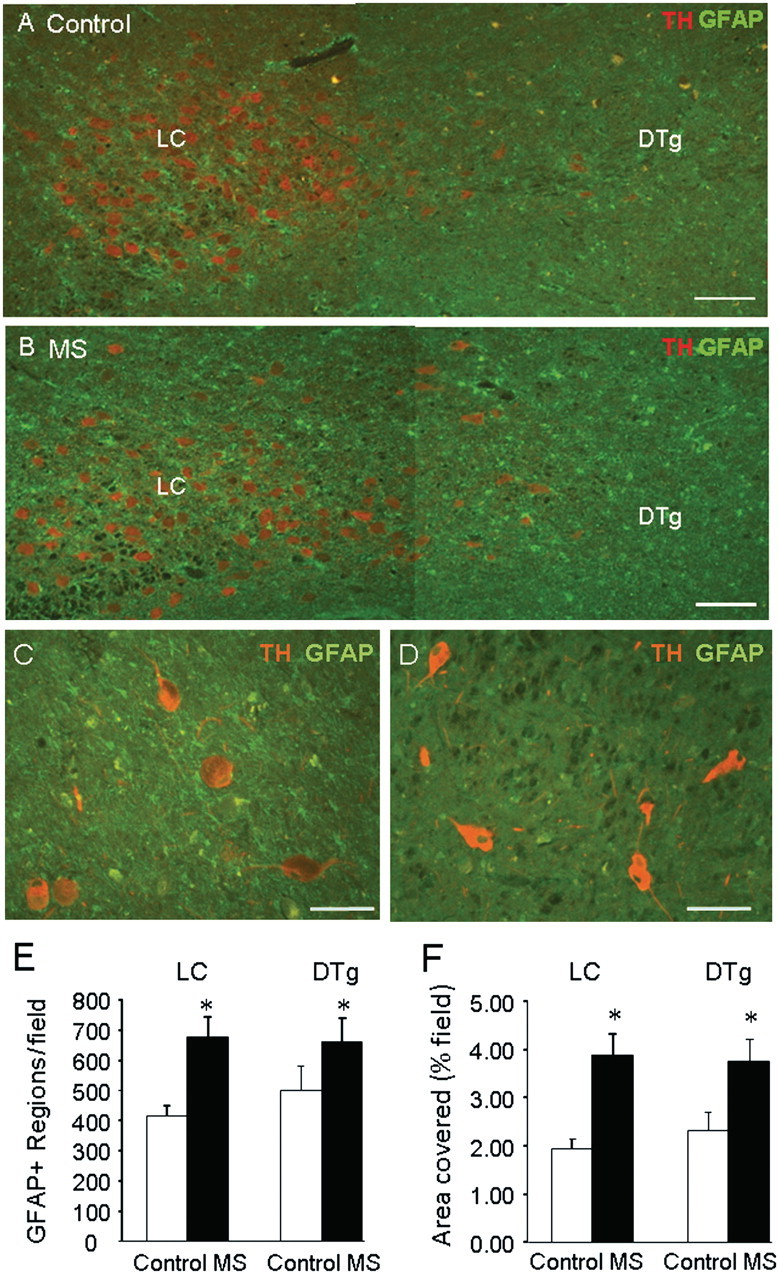
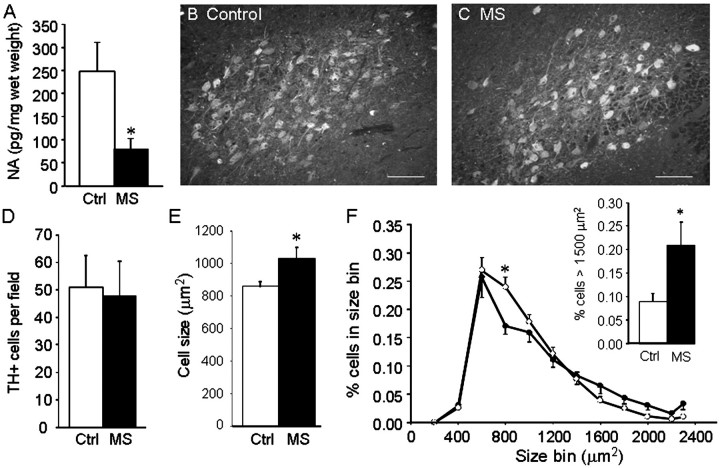
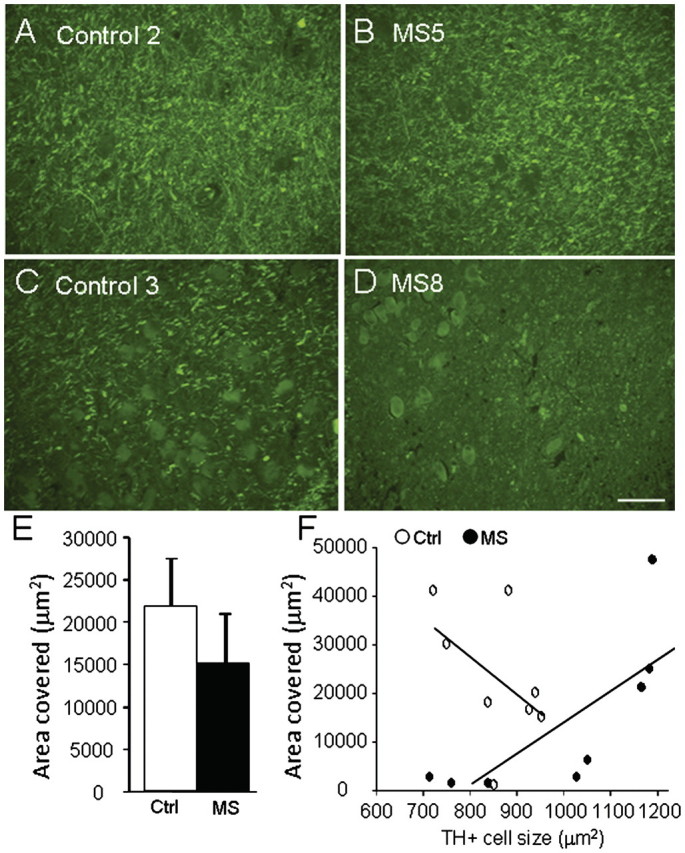
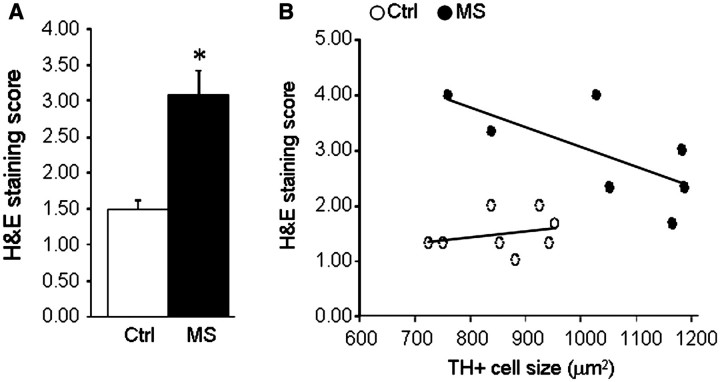
The endogenous neurotransmitter noradrenaline exerts anti-inflammatory and neuroprotective effects in vitro and in vivo. Several studies report that noradrenaline levels are altered in the central nervous system of patients with multiple sclerosis and rodents with experimental autoimmune encephalomyelitis, which could contribute to pathology. Since the major source of noradrenaline are neurons in the locus coeruleus, we hypothesized that alterations in noradrenaline levels are a consequence of stress or damage to locus coeruleus neurons. In C57BL/6 mice immunized with myelin oligodendrocyte glycoprotein peptide 35-55 to develop chronic disease, cortical and spinal cord levels of noradrenaline were significantly reduced versus control mice. Immunohistochemical staining revealed increased astrocyte activation in the ventral portion of the locus coeruleus in immunized mice. The immunized mice showed neuronal damage in the locus coeruleus detected by a reduction of average cell size of tyrosine hydroxylase stained neurons. Analysis of the locus coeruleus of multiple sclerosis and control brains showed a significant increase in astrocyte activation, a reduction in noradrenaline levels, and neuronal stress indicated by hypertrophy of tyrosine hydroxylase stained cell bodies. However, the magnitude of these changes was not correlated with extent of demyelination or of cellular infiltrates. Together these findings demonstrate the presence of inflammation and neuronal stress in multiple sclerosis as well as in experimental autoimmune encephalomyelitis. Since reduced noradrenaline levels could be permissive for increased inflammation and neuronal damage, these results suggest that methods to raise noradrenaline levels or increase locus coeruleus function may be of benefit in treating multiple sclerosis.


Figures

Figure 1
Figure 1
Cortical and spinal cord noradrenaline levels are decreased in EAE. Tissue lysates were prepared from EAE mice (filled bars) at 60 days after the initial myelin oligodendrocyte glycoprotein (MOG) peptide immunization, at which point they had clinical scores of 2–4. Age- and sex-matched non-immunized mice served as controls (Ctrl, open bars). Noradrenaline (NA) levels were quantified by specific enzyme-linked immunosorbent assay in samples from frontal cortex (CTX: n = 10 controls, n = 9 EAE); spinal cord (SC: n = 15 controls, n = 12 EAE) and locus coeruleus (LC: n = 6 controls, n = 4 EAE). Data is pg noradrenaline per mg wet weight tissue and are means ± SEM; *P < 0.05 versus control; §P < 0.05 versus control CTX (unpaired t-test).
Figure 2
Figure 2
GFAP staining is increased in locus coeruleus of EAE mice. Serial sagittal sections were prepared from four EAE and three control mice taken at Day 60, and stained with antibodies to tyrosine hydroxylase (TH, green) and GFAP (red). Representative images taken from the mid-central portion of the locus coeruleus and from the substantia nigra are shown from control (A and C) and EAE (B and D) mice. (A and B) The fourth ventricle is located above and to the left; the area containing dorsal subcoeruleus neurons (SCD) is indicated. GFAP staining was quantified in 8–12 serial sections per mouse. Data are means ± SEM for total area stained (per cent field of view) in the locus coeruleus; and for total number of stained objects (cell bodies and processes) per field of view in F the locus coeruleus and the substantia nigra. *P < 0.05 versus control (unpaired t-test). Scale bars are 200 µm. d = dorsal; c = central; v = ventral; SNc = substantia nigra pars compacta; SNr = substantia nigra pars reticulata.
Figure 3
Figure 3
Tyrosine hydroxylase positive stained neurons are smaller in locus coeruleus of EAE mice. Serial sagittal sections were prepared from four EAE and three control mice taken at Day 60, and stained to detect tyrosine hydroxylase in the locus coeruleus and the substantia nigra. Representative images from the mid-central portion of the locus coeruleus of control (A) and EAE (B) mice are shown which highlight the presence of smaller-sized tyrosine hydroxylase positive stained neurons (asterisk) in EAE (D) but not control (C) mice. (E) Quantitative analysis carried out of 8–12 serial sections per mouse through the locus coeruleus (LC) or through the substantia nigra (SN) (representative images are shown in Fig. 2) did not show a significant change in the total number of tyrosine hydroxylase (TH) positive stained neurons per section. (F) Quantitation of average cell size using data from three sections per mouse revealed a significant reduction of locus coeruleus, but not substantia nigra, neuronal cell body in EAE versus control (mean ± SEM; *P < 0.05). (G) The distribution of tyrosine hydroxylase positive stained cell sizes was determined from 804 control cells (open circles) and 1276 EAE cells (filled circles). Control mice have the greatest percentages of cells in the range of 200–400 µm2, with fewer cells in the lower and higher size ranges. In EAE mice a greater percentage of cells were present in the smaller (<150 µm2) size range. Data are means ± SD of distributions calculated for the three control and four EAE mice. *P < 0.05 versus control [two-way ANOVA F(15, 1) = 4.17; and Bonferroni’s post hoc]. Each cell size bin includes cells having areas of that size ±25 µm2. Scale bars are 200 µm in A and B.
Figure 4
Figure 4
Levels of EAR2 and BDNF messenger RNAs are reduced in EAE. Total cytosolic RNA was prepared from (A) locus coeruleus (LC) and (B) spinal cord (SC) of three EAE and three control mice at Day 60, converted to complementary DNA, and relative levels of the messenger RNAs for EAR2 and BDNF measured by real time quantitative polymerase chain reaction, and normalized to values for α-actin measured in the same samples. The data are the mean ± SD of messenger RNA levels relative to those measured in the control locus coeruleus samples. *P < 0.05; EAE versus control.
Figure 5
Figure 5
GFAP staining is increased in the locus coeruleus region of multiple sclerosis brains. Serial coronal sections through the locus coeruleus (LC) were prepared from five patients with multiple sclerosis (MS) and six controls, and stained for tyrosine hydroxylase (TH) and GFAP. The fourth ventricle is located above and to the right. Representative images from control (A) and patients (B) with multiple sclerosis show increased GFAP positive staining in the locus coeruleus and adjacent area (containing the dorsal tegmental nuclei, DTg). Representative images from one multiple sclerosis sample showing presence of GFAP staining around tyrosine hydroxylase positive stained neurons in locus coeruleus (C) but not in adjacent central pons (D). Quantitation of staining showed a significant increase in (E) the number of GFAP positive stained objects (cell bodies and processes) and (F) the total area stained (per cent field of view) in both the locus ceruleus and the dorsal tegmental nuclei of multiple sclerosis samples versus controls. Data are means ± SEM of nine sections per brain; *P < 0.05 versus controls. Scale bars are 200 µm in A and B and 100 µm in C and D.
Figure 6
Figure 6
Locus coeruleus neuronal stress is present in multiple sclerosis. (A) Noradrenaline (NA) levels were measured in 10 areas located near the locus coeruleus as described in ‘Methods’ section, in samples from five patients with multiple sclerosis (MS) and seven controls (Ctrl), and values from the 10 areas averaged. Data are means ± SEM of pg noradrenaline/mg wet weight; *P < 0.05 versus controls. Representative images of tyrosine hydroxylase staining from control (B) and patient with multiple sclerosis (C) encompassing most of the locus coeruleus. Quantitative image analysis carried out on nine serial sections from eight multiple sclerosis and eight control samples did not show any significant difference in the total number of tyrosine hydroxylase positive stained neurons per field of view (D); however, the average cell size was significantly increased in patients with multiple sclerosis (E). The distribution of tyrosine hydroxylase positive cell sizes (F) calculated from 3408 cells in the patients with multiple sclerosis (filled circles) and 3660 cells from the controls (open circles) shows fewer cells of size range 700–900 µm2 in patients with multiple sclerosis compared with controls [F(11, 1) = 2.131, P = 0.021], with a significantly greater percentage of cells having areas >1500 µm2 in the patients with multiple sclerosis (F, inset). Data are means ± SEM, *P < 0.01 versus controls (Bonferroni’s post hoc). Each cell size bin includes cells with areas that size ± 100 µm2. Scale bars are 200 µm.
Figure 7
Figure 7
Relationship between proteolipid protein staining and locus coeruleus stress. Serial coronal sections through the locus coeruleus (LC) were prepared from eight patients with multiple sclerosis (MS) and eight controls, and stained for proteolipid protein. Representative images showing staining from two controls (A and C) and two patients with multiple sclerosis (B and D), show large variation in extent of proteolipid protein staining. (E) Quantitation of total proteolipid protein area stained (mean ± SE of 2–3 sections per brain) shows a non-significant (P = 0.32) decrease in multiple sclerosis samples versus controls. (F) Comparison of proteolipid protein area stained versus average tyrosine hydroxylase positive cell size in control (open circles) and multiple sclerosis (closed circles) sections reveals a significant correlation in the multiple sclerosis samples (Spearman r = 0.93, P = 0.0022). Scale bars are 200 µm.
Figure 8
Figure 8
Relationship between haematoxylin and eosin staining and locus coeruleus stress. Serial coronal sections through the locus coeruleus were prepared from eight patients with multiple sclerosis and eight controls, stained with haematoxylin and eosin (H&S) for cell infiltrates, and sections (three per brain) scored from 1–4 as described in the ‘Methods’ section. (A) Data are mean ± SE of average haematoxylin and eosin score in controls and multiple sclerosis samples (*P < 0.01). (B) Comparison of average haematoxylin and eosin score versus average tyrosine hydroxylase positive cell size in control (open circles) and multiple sclerosis (closed circles) sections reveals a significant correlation in the multiple sclerosis samples (Spearman r = −0.773, P = 0.028).

Comment in

Similar articles

Cited by

References

    1. Adolfsson R, Gottfries CG, Roos BE, Winblad B. Changes in the brain catecholamines in patients with dementia of Alzheimer type. Br J Psychiatry. 1979;135:216–23. - PubMed
    1. Barkhatova VP, Zavalishin IA, Askarova LS, Shavratskii VK, Demina EG. Changes in neurotransmitters in multiple sclerosis. Neurosci Behav Physiol. 1998;28:341–4. - PubMed
    1. Benarroch EE. The locus ceruleus norepinephrine system: functional organization and potential clinical significance. Neurology. 2009;73:1699–704. - PubMed
    1. Benveniste EN, Huneycutt BS, Shrikant P, Ballestas ME. Second messenger systems in the regulation of cytokines and adhesion molecules in the central nervous system. Brain Behav Immun. 1995;9:304–14. - PubMed
    1. Bondareff W, Mountjoy CQ, Roth M, Rossor MN, Iversen LL, Reynolds GP, et al. Neuronal degeneration in locus ceruleus and cortical correlates of Alzheimer disease. Alzheimer Dis Assoc Disord. 1987;1:256–62. - PubMed

Publication types

MeSH terms