

Estimating the acute health effects of coarse particulate matter accounting for exposure measurement error
- PMID: 21297159
- PMCID: PMC3202305
- DOI: 10.1093/biostatistics/kxr002
Estimating the acute health effects of coarse particulate matter accounting for exposure measurement error
Abstract
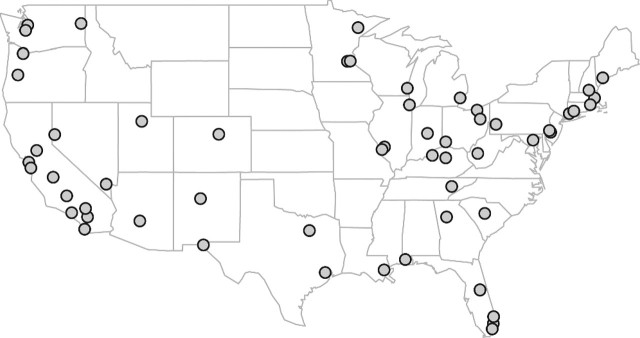
In air pollution epidemiology, there is a growing interest in estimating the health effects of coarse particulate matter (PM) with aerodynamic diameter between 2.5 and 10 μm. Coarse PM concentrations can exhibit considerable spatial heterogeneity because the particles travel shorter distances and do not remain suspended in the atmosphere for an extended period of time. In this paper, we develop a modeling approach for estimating the short-term effects of air pollution in time series analysis when the ambient concentrations vary spatially within the study region. Specifically, our approach quantifies the error in the exposure variable by characterizing, on any given day, the disagreement in ambient concentrations measured across monitoring stations. This is accomplished by viewing monitor-level measurements as error-prone repeated measurements of the unobserved population average exposure. Inference is carried out in a Bayesian framework to fully account for uncertainty in the estimation of model parameters. Finally, by using different exposure indicators, we investigate the sensitivity of the association between coarse PM and daily hospital admissions based on a recent national multisite time series analysis. Among Medicare enrollees from 59 US counties between the period 1999 and 2005, we find a consistent positive association between coarse PM and same-day admission for cardiovascular diseases.
Figures


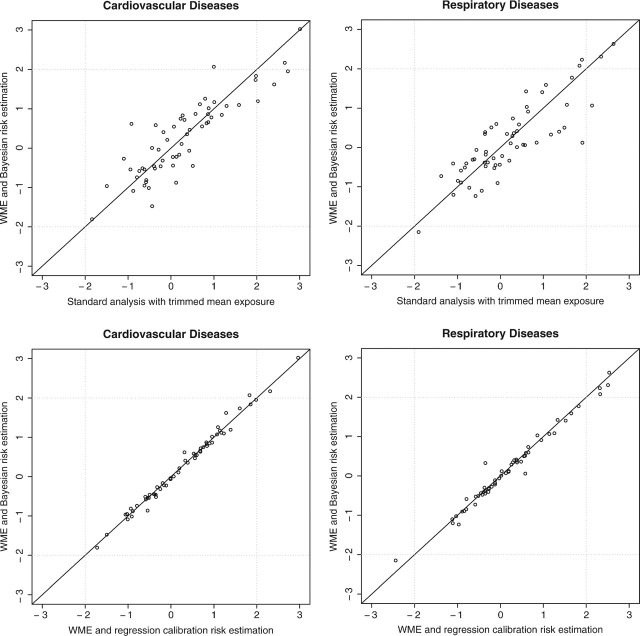
 , comparing 2 approaches: (1) including ME modeling with monitor-specific weighted error variance (WME) versus (2) using TM as PM10 − 2.5 exposure. Lower panels: scatter plot of county-specific standardized health-effect estimates for PM10 − 2.5, , using exposure derived from WME comparing Bayesian risk estimation versus regression calibration.
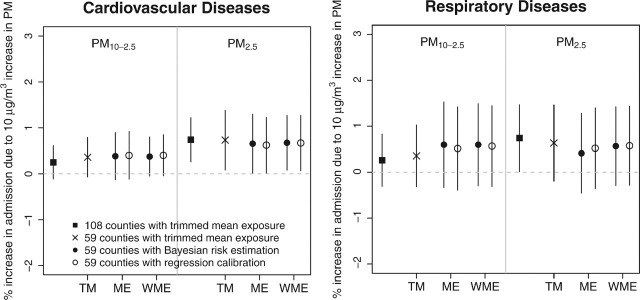
References
-
- Bachmann J. Will the circle by unbroken: a history of the US National Ambient Air Quality Standards. Journal of the Air & Waste Management Association. 2007;57:652–697. - PubMed
-
- Brunekreef B, Forsberg B. Epidemiological evidence of effects of coarse airborne particles on health. European Respiratory Journal. 2005;26:309–318. - PubMed
-
- Carroll RJ, Ruppert D, Stefanski LA, Crainiceanu CM. Measurement Error in Nonlinear Models: a Modern Perspective. New York: Chapman & Hall; 2006.
-
- Castillejos M, Borja-Aburto VH, Dockery DW, Gold DR, Loomis D. Airborne coarse particles and mortality. Inhalation Toxicology. 2000;12:61–72.
-
- Dockery DW, Pope CA, Xu X, Spengler JD, Ware JH, Fay ME, Ferris BG, Speizer FE. An association between air pollution and mortality in six U.S. cities. The New England Journal of Medicine. 1993;329:1753–1759. - PubMed
Publication types
MeSH terms
Substances
Grants and funding
LinkOut - more resources
Full Text Sources
