Global trends in molecular epidemiology of HIV-1 during 2000-2007
- PMID: 21297424
- PMCID: PMC3755761
- DOI: 10.1097/QAD.0b013e328342ff93
Global trends in molecular epidemiology of HIV-1 during 2000-2007
Abstract
Objective: To estimate the global and regional distribution of HIV-1 subtypes and recombinants between 2000 and 2007.
Design: Country-specific HIV-1 molecular epidemiology data were combined with estimates of the number of HIV-infected people in each country.
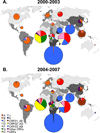
Methods: Cross-sectional HIV-1 subtyping data were collected from 65 913 samples in 109 countries between 2000 and 2007. The distribution of HIV-1 subtypes in individual countries was weighted according to the number of HIV-infected people in each country to generate estimates of regional and global HIV-1 subtype distribution for the periods 2000-2003 and 2004-2007.
Results: Analysis of the global distribution of HIV-1 subtypes and recombinants in the two periods indicated a broadly stable distribution of HIV-1 subtypes worldwide with a notable increase in the proportion of circulating recombinant forms (CRFs), a decrease in unique recombinant forms (URFs) and an overall increase in recombinants. In 2004-2007, subtype C accounted for nearly half (48%) of all global infections, followed by subtypes A (12%) and B (11%), CRF02_AG (8%), CRF01_AE (5%), subtype G (5%) and D (2%). Subtypes F, H, J and K together cause fewer than 1% of infections worldwide. Other CRFs and URFs are each responsible for 4% of global infections, bringing the combined total of worldwide CRFs to 16% and all recombinants (CRFs along with URFs) to 20%.
Conclusion: The global and regional distributions of individual subtypes and recombinants are broadly stable, although CRFs may play an increasing role in the HIV pandemic. The global diversity of HIV-1 poses a formidable challenge to HIV vaccine development.
Conflict of interest statement
We declare that we have no conflicts of interest.
Figures


Comment in
-
Toward a robust monitoring of HIV subtypes distribution worldwide.AIDS. 2011 Mar 13;25(5):713-4. doi: 10.1097/QAD.0b013e32834543e7. AIDS. 2011. PMID: 21368591 No abstract available.
References
-
- UNAIDS. AIDS Epidemic Update 2009. Geneva: 2009.
-
- Los Alamos National Laboratory. http://www.hiv.lanl.gov.
-
- Robertson DL, Anderson JP, Bradac JA, Carr JK, Foley B, Funkhouser RK, et al. HIV-1 nomenclature proposal. Science. 2000;288:55–56. - PubMed
Publication types
MeSH terms
Grants and funding
LinkOut - more resources
Full Text Sources
Other Literature Sources
Medical

