. 2011 Mar 2;30(5):906-19.
doi: 10.1038/emboj.2011.15. Epub 2011 Feb 4.

A TACC3/ch-TOG/clathrin complex stabilises kinetochore fibres by inter-microtubule bridging

Affiliations

A TACC3/ch-TOG/clathrin complex stabilises kinetochore fibres by inter-microtubule bridging

Daniel G Booth et al. EMBO J. .

Abstract

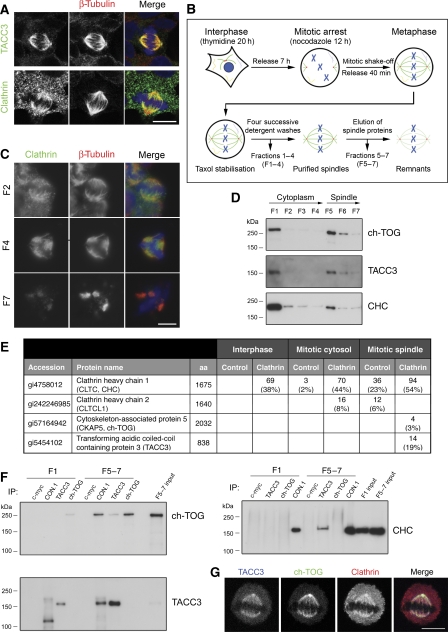
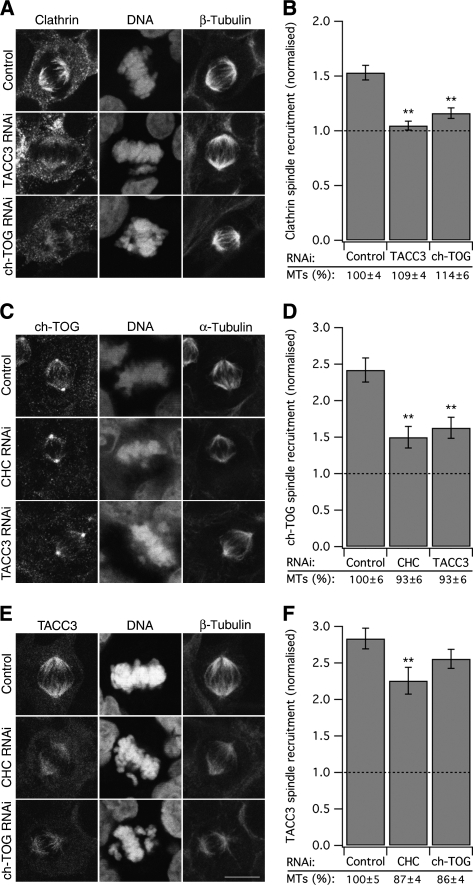
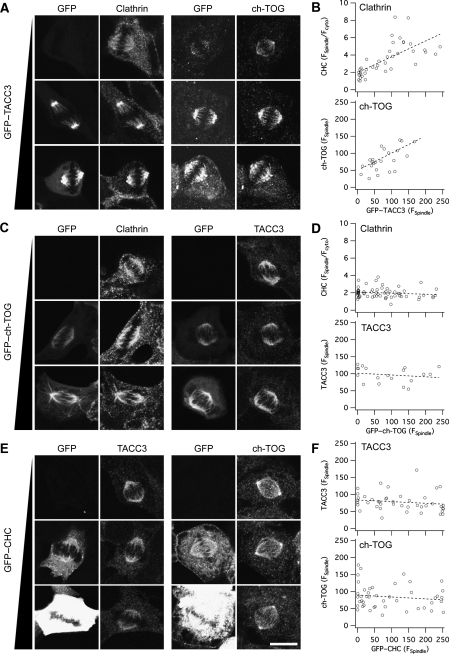
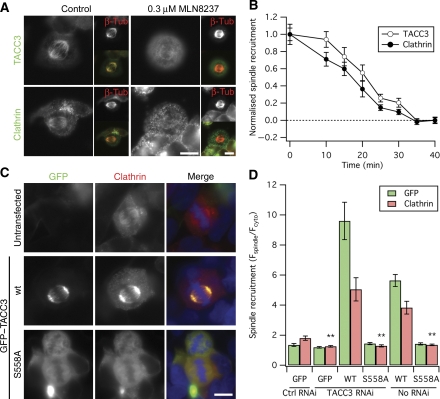
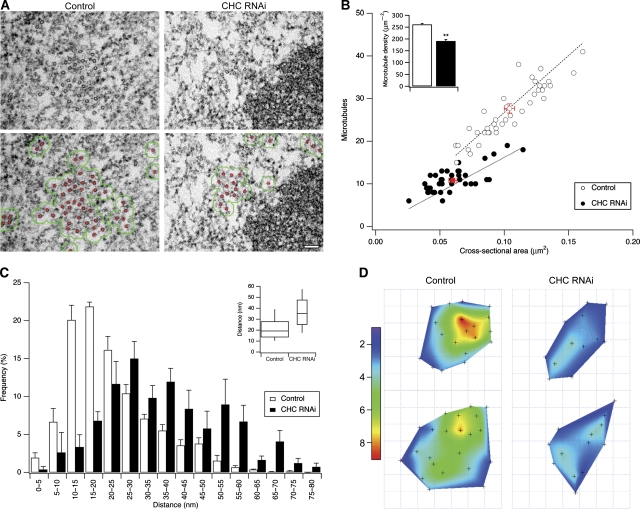
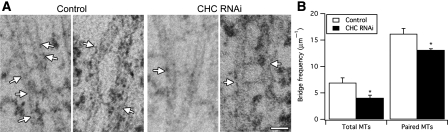
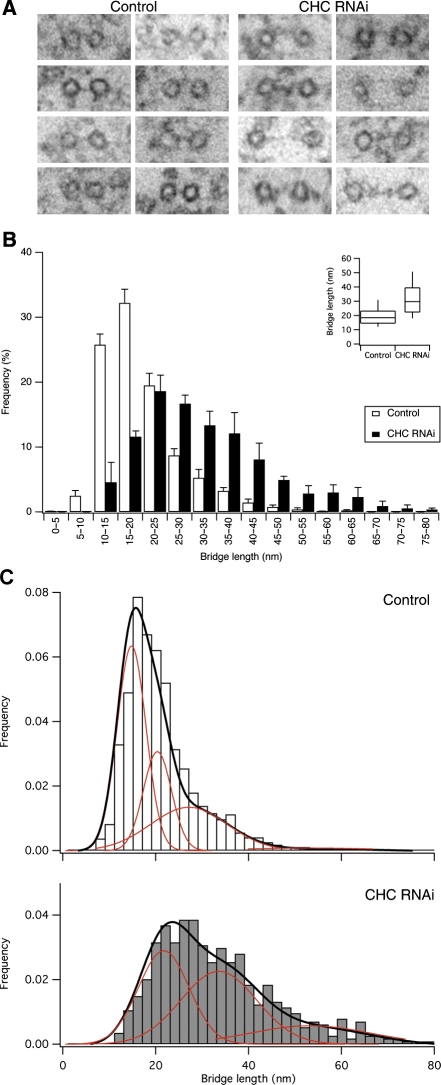
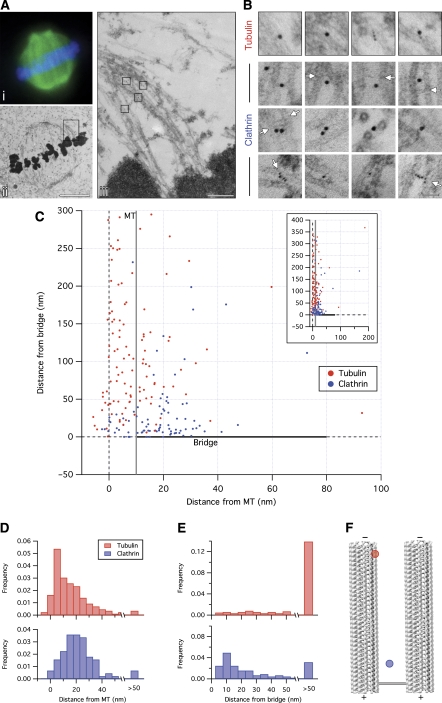
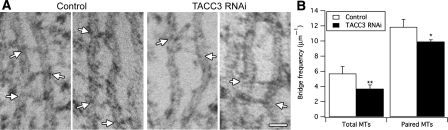
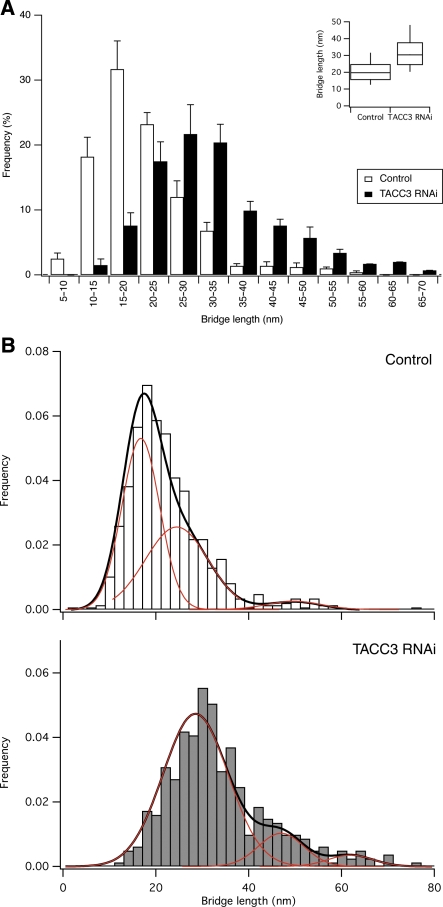
Kinetochore fibres (K-fibres) of the spindle apparatus move chromosomes during mitosis. These fibres are discrete bundles of parallel microtubules (MTs) that are crosslinked by inter-MT 'bridges' that are thought to improve fibre stability during chromosomal movement. The identity of these bridges is unknown. Clathrin is a multimeric protein that has been shown to stabilise K-fibres during early mitosis by a mechanism independent of its role in membrane trafficking. In this study, we show that clathrin at the mitotic spindle is in a transforming acidic colied-coil protein 3 (TACC3)/colonic, hepatic tumour overexpressed gene (ch-TOG)/clathrin complex. The complex is anchored to the spindle by TACC3 and ch-TOG. Ultrastructural analysis of clathrin-depleted K-fibres revealed a selective loss of a population of short inter-MT bridges and a general loss of MTs. A similar loss of short inter-MT bridges was observed in TACC3-depleted K-fibres. Finally, immunogold labelling confirmed that inter-MT bridges in K-fibres contain clathrin. Our results suggest that the TACC3/ch-TOG/clathrin complex is an inter-MT bridge that stabilises K-fibres by physical crosslinking and by reducing rates of MT catastrophe.


Conflict of interest statement

The authors declare that they have no conflict of interest.

Figures

Figure 1
Figure 1
Clathrin at the mitotic spindle is in a complex with TACC3 and ch-TOG. (A) Representative confocal micrographs to illustrate the different subcellular distributions of endogenous clathrin and TACC3 in mitotic HEK293 cells. (B) Schematic diagram of the experimental protocol to release proteins from mitotic spindles at metaphase. After each spin, the supernatant was collected (fractions 1–7, F1–7). (C) Fluorescence micrographs of pelleted material from the purification spotted onto coverslips, fixed and processed for immunofluorescence. Clathrin remains on spindles following detergent washes and was released from spindles using 0.3 M NaCl. The fraction number (F2, F4, F7) indicates the stage of the purification. (D) Western blots of fractions from the spindle purification to show the ‘release' of ch-TOG, TACC3 and clathrin from spindles. (E) Table to show the number of peptides and % coverage (in parentheses) for proteins detected by mass spectrometry in a single experiment. IPs were performed on interphase cell lysate, mitotic cytosol (fraction 1) and spindle fractions (combined fractions 5–7) using either CON.1, a monoclonal clathrin light chain antibody, or anti-myc/9E10 as a control. Immunoprecipitated material was separated by 12% SDS–PAGE and samples analysed by tandem mass spectrometry. (F) Reciprocal immunoprecipitation and western blotting of complex members from F1 or F5–7. In spindle fractions, TACC3 and ch-TOG were detected in clathrin IPs, clathrin and ch-TOG were detected in TACC3 IPs, but TACC3 and clathrin were not detected in ch-TOG IPs. This may be due to an excess of ch-TOG in the fractions that is not associated with TACC3/clathrin or that the ch-TOG antibody is not compatible with co-IP experiments. (G) Confocal micrographs to show the co-localisation of interaction partners at the metaphase spindle. HeLa cells co-expressing low levels of tdTomato–LCa and GFP–ch-TOG were immunostained with anti-TACC3. Scale bars, 10 μm.
Figure 2
Figure 2
Spindle localisation of TACC3/ch-TOG/clathrin complex components following RNAi. Representative confocal micrographs to show the spindle recruitment of endogenous (A) clathrin (C) ch-TOG or (E) TACC3 following the individual depletion of the other two complex members. A fluorescent reporter confirmed the expression of shRNA (not shown). Bar charts to show spindle recruitment of endogenous (B) clathrin, (D) ch-TOG or (F) TACC3 following individual depletion of the other complex members. Spindle recruitment was measured as described in Materials and methods. Note that a value of 1 represents no detectable recruitment. The average MT intensity at the spindle normalised to control (%) is shown and did not account for the changes observed. Bars represent mean±s.e.m., ncell=45–116 from three independent experiments; **P<0.01. Scale bar, 10 μm.
Figure 3
Figure 3
Spindle localisation of TACC3/ch-TOG/clathrin complex components following overexpression. Representative confocal micrographs to show the spindle recruitment of the other two complex members following the individual overexpression of GFP-tagged TACC3 (A), ch-TOG (C) and clathrin (E) in HEK293 cells. Three conditions are shown: low or no expression (top), medium expression (middle) and high expression (bottom). In A, right panels, GFP–TACC3 was also detected with TACC3/A488. Spindle recruitment of endogenous proteins was visualised by immunostaining, and expressed protein was visualised by GFP fluorescence. (B, D, F) Plots of immunofluorescence as a function of GFP expression at the spindle are shown as indicated. A linear fit to the data is shown as a dotted line. Scale bar, 10 μm.
Figure 4
Figure 4
Recruitment of clathrin to the mitotic spindle is controlled by phosphorylation of TACC3 by Aurora-A kinase. (A) Representative micrographs of HEK293 cells incubated with 0.3 μM MLN8237 for 40 min. Cells were fixed and stained as indicated. (B) Time course of the reduction in spindle recruitment of endogenous clathrin and TACC3 by treatment of cells with 0.3 μM MLN8237. Data are mean±s.e.m., scaled to allow comparison of kinetics. The spindle recruitment for TACC3 and clathrin was 3.89±0.19 and 3.04±0.22 at 0 min and 1.32±0.08 and 1.08±0.07 at 40 min, respectively. (C) Representative fluorescence micrographs of mCherry-LCa (red) distribution in cells co-expressing GFP–TACC3 or GFP–TACC3(S558A). Triskelia are labelled by constitutive incorporation of mCherry-LCa (Hoffmann et al, 2010). (D) Bar chart to show recruitment of mCherry-LCa (red) in cells expressing GFP–TACC3 or GFP–TACC3(S558A). Note the decrease in clathrin from the spindle in cells expressing GFP–TACC3(S558A) compared to no co-expression. Bars, mean±s.e.m., **P<0.01. Scale bars, 10 μm.
Figure 5
Figure 5
Clathrin-depleted K-fibres have fewer microtubules. (A) Typical electron micrographs of orthogonal sections from control or clathrin-depleted HeLa cells. Below, MTs are highlighted in red and the fibre outline is shown in green (see Materials and Methods). Scale bar, 100 nm. (B) Scatter plot showing the number of MTs per fibre versus cross-sectional area of the fibre. Markers show the value for individual fibres from control RNAi cells (open) or CHC RNAi cells (closed). Red markers show the mean±s.e.m. Dashed line is a fit constrained through the origin to indicate MT density. Inset: bar chart of MT density, ncell=4–6; **P<0.01. (C) Histogram to show the distance to the nearest neighbouring MT for each MT in the fibre. Bars show mean±s.e.m. ncell=4–6, nfibre=41–38, control versus CHC RNAi. Inset: Tukey plot for all nearest neighbour distances, nMT=1135–420. (D) ‘Heat maps' of a typical K-fibre from control or CHC RNAi cells. The co-ordinates of each MT in the fibre are plotted and the number of neighbouring MTs within 80 nm is indicated with a 2D surface of a Voronoi interpolation. The maximum observed length of inter-MT bridges was 80 nm and therefore this was the definition of neighbouring MTs within bridging distance of one another.
Figure 6
Figure 6
Clathrin-depleted K-fibres exhibit loss of inter-MT bridges. (A) Representative electron micrographs of K-fibres in longitudinal sections from control or clathrin-depleted cells. Arrows mark sites of inter-MT bridges. (B) Bar chart to show the frequency of bridges per μm of MT (total MTs) or per μm of paired MTs within 80 nm of each other (paired MTs). Bars show mean±s.e.m; *P<0.05. Scale bar, 40 nm.
Figure 7
Figure 7
Clathrin-depleted K-fibres lack short inter-MT bridges. (A) Gallery of inter-MT bridges selected at random from electron micrographs of orthogonal sections to illustrate the apparent increase in bridge length in clathrin-depleted K-fibres. (B) Histogram to show the size distribution of inter-MT bridges from control or clathrin-depleted cells. Mean±s.e.m., ncell=3–4. Inset: Tukey plot for all bridge distances nbridge=1335–570. (C) Histograms of bridge size distribution of all bridges to illustrate putative bridge populations. Multi-peak analysis of CHC RNAi data (grey, below) indicated three populations with mean lengths of 21.8, 33.6 and 53.3 nm. Control RNAi cells (open, above) had an additional 14.8 nm bridge population, see Supplementary Figure 4. Individual populations, red; sum of populations, black.
Figure 8
Figure 8
Inter-MT bridges in K-fibres contain clathrin. (A) A mitotic spindle purified from HeLa cells expressing GFP–α-tubulin, visualised by light (Ai) and electron (Aii and Aiii) microscopy following immunogold labelling (see Materials and methods). A view of the two K-fibres in the boxed region of Aii is shown in Aiii. Boxes in Aiii show the location of immunogold shown in B. Scale bar, 5 μm (ii) and 500 nm (iii). (B) Examples of immunogold labelling for tubulin or for clathrin. Spindles purified from cells expressing GFP–α-tubulin or GFP–CHC were labelled with anti-GFP and anti-tubulin or anti-GFP and anti-clathrin. Detection was with 5 and 10 nm gold-conjugated secondary antibodies. Arrows mark the site of bridges. A 2D plot (C) of gold particle locations relative to the MT centre (x axis) or the nearest bridge (y axis). Grey and black lines indicate the edge of the MT and the bridge, respectively. Inset: collapsed view of the data set. (D, E) Location of gold particles relative to MTs and bridges. Frequency histograms to show the distance from gold particles to the nearest MT centre (D) or to the nearest inter-MT bridge (E) (ntubulin=120, nclathrin=89). (F) Median distances from the data set are plotted on a scaled representation of two MTs and an idealised straight bridge.
Figure 9
Figure 9
TACC3-depleted K-fibres exhibit loss of inter-MT bridges. (A) Representative electron micrographs of K-fibres in longitudinal sections from control or TACC3-depleted cells. Arrows mark sites of inter-MT bridges. (B) Bar chart to show the frequency of bridges per μm of MT (total MTs) or per μm of paired MTs within 80 nm of each other (paired MTs). Bars show mean±s.e.m.; **P<0.01, *P<0.05. Scale bar, 40 nm.
Figure 10
Figure 10
TACC3-depleted K-fibres lack short inter-MT bridges. (A) Histogram to show the size distribution of inter-MT bridges from control or TACC3-depleted cells. Mean±s.e.m., ncell=6–7. Inset: Tukey plot for all bridge distances nbridge=732–406. (B) Histograms of bridge size distribution of all bridges to illustrate putative bridge populations. Multi-peak analysis of TACC3 RNAi data (grey, below) indicated three populations with mean lengths of 28.5, 47.0 and 61.9 nm. Control RNAi cells (open, above) had an additional 16.7 nm bridge population, see Supplementary Figure 4. Individual populations, red; sum of populations, black.

Similar articles

Cited by

References

    1. Barr AR, Gergely F (2007) Aurora-A: the maker and breaker of spindle poles. J Cell Sci 120: 2987–2996 - PubMed
    1. Barr AR, Gergely F (2008) MCAK-independent functions of ch-Tog/XMAP215 in microtubule plus-end dynamics. Mol Cell Biol 28: 7199–7211 - PMC - PubMed
    1. Bieling P, Telley IA, Surrey T (2010) A minimal midzone protein module controls formation and length of antiparallel microtubule overlaps. Cell 142: 420–432 - PubMed
    1. Brodsky FM, Chen CY, Knuehl C, Towler MC, Wakeham DE (2001) Biological basket weaving: formation and function of clathrin-coated vesicles. Annu Rev Cell Dev Biol 17: 517–568 - PubMed
    1. Brouhard GJ, Stear JH, Noetzel TL, Al-Bassam J, Kinoshita K, Harrison SC, Howard J, Hyman AA (2008) XMAP215 is a processive microtubule polymerase. Cell 132: 79–88 - PMC - PubMed

Publication types

MeSH terms