. 2011 Mar;18(3):395-400.
doi: 10.1038/nsmb.1988. Epub 2011 Feb 6.

Genome-wide mapping of Arabidopsis thaliana origins of DNA replication and their associated epigenetic marks

Affiliations

Genome-wide mapping of Arabidopsis thaliana origins of DNA replication and their associated epigenetic marks

Celina Costas et al. Nat Struct Mol Biol. 2011 Mar.

Abstract

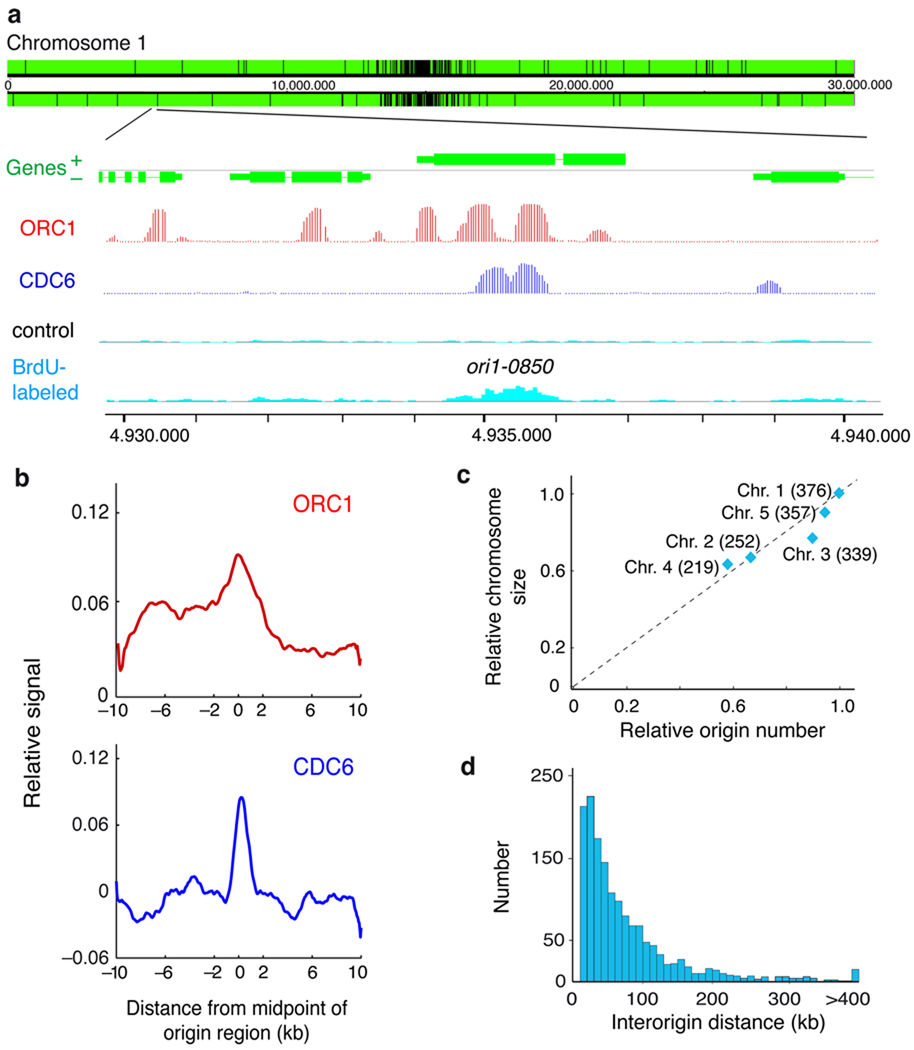
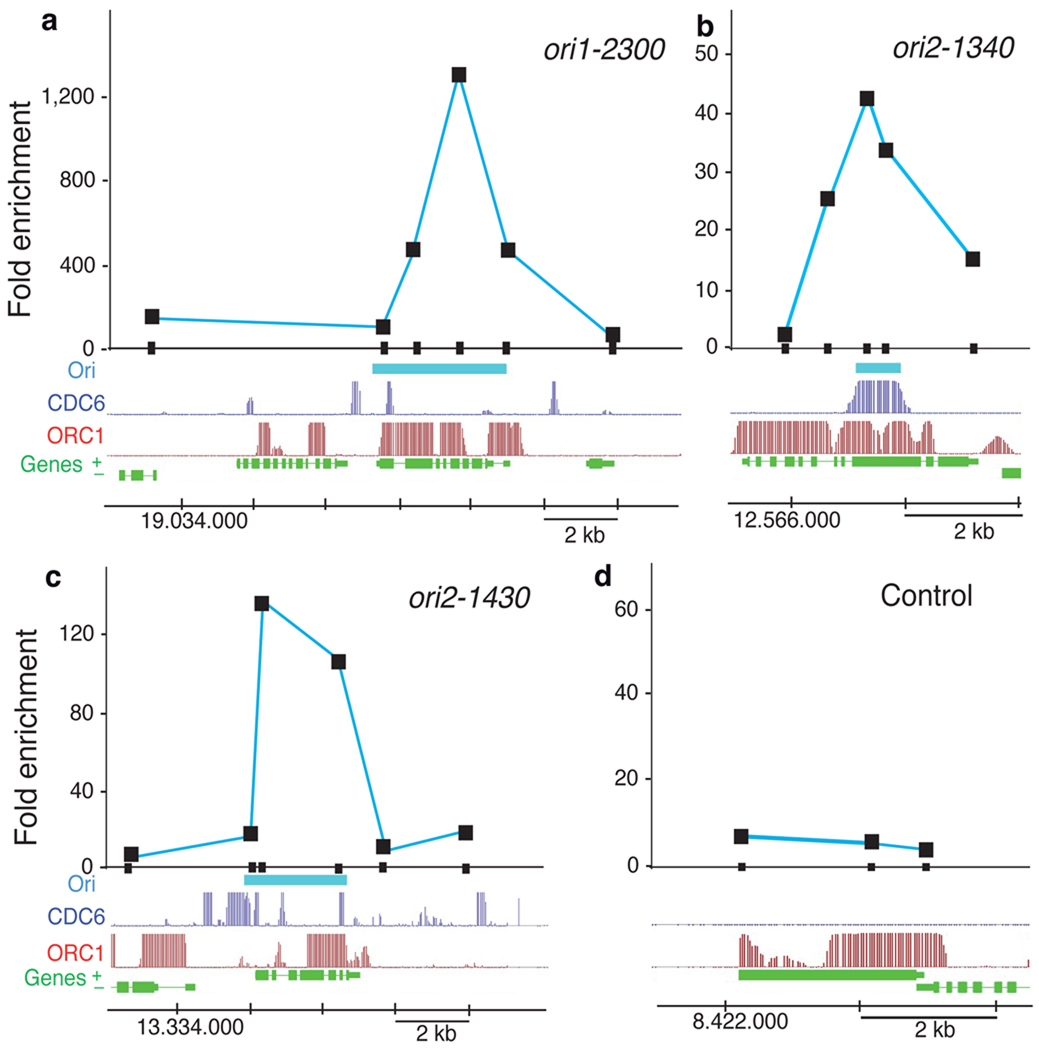
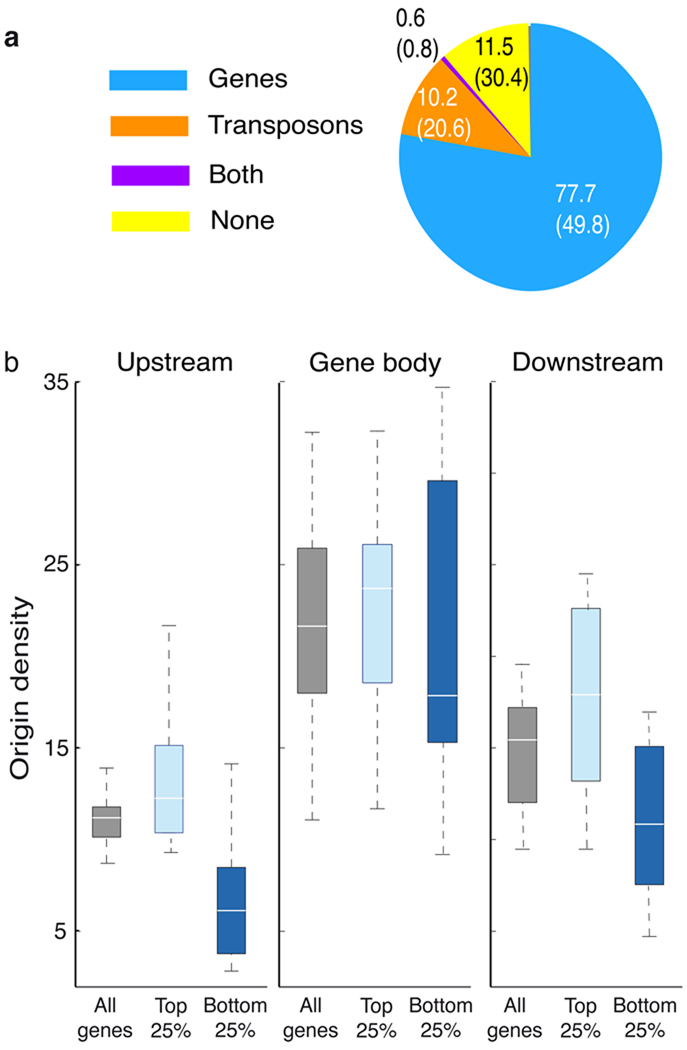
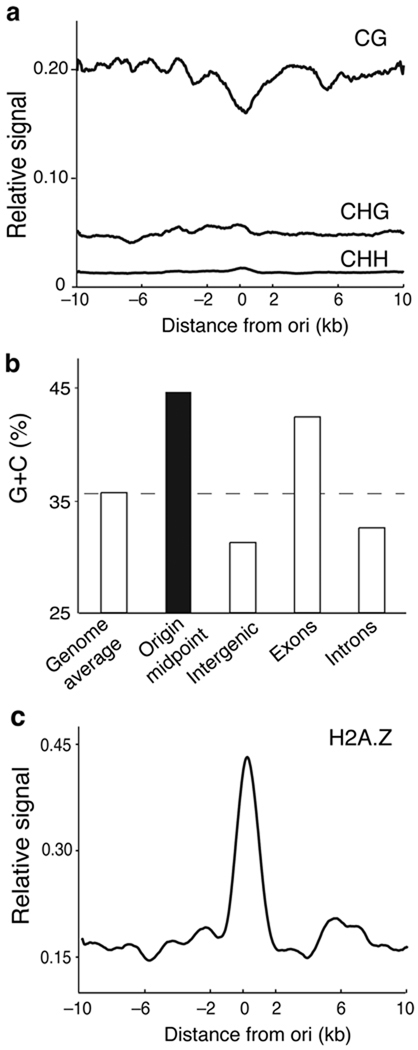
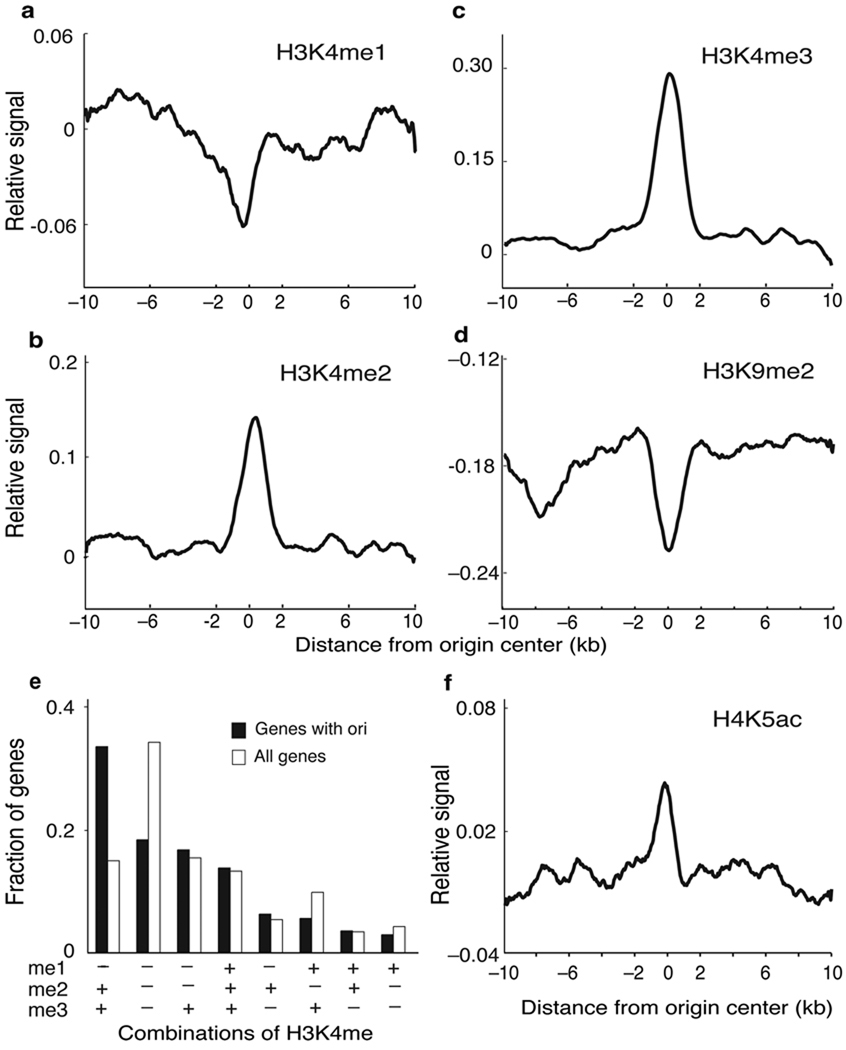
Genome integrity requires faithful chromosome duplication. Origins of replication, the genomic sites at which DNA replication initiates, are scattered throughout the genome. Their mapping at a genomic scale in multicellular organisms has been challenging. In this study we profiled origins in Arabidopsis thaliana by high-throughput sequencing of newly synthesized DNA and identified ~1,500 putative origins genome-wide. This was supported by chromatin immunoprecipitation and microarray (ChIP-chip) experiments to identify ORC1- and CDC6-binding sites. We validated origin activity independently by measuring the abundance of nascent DNA strands. The midpoints of most A. thaliana origin regions are preferentially located within the 5' half of genes, enriched in G+C, histone H2A.Z, H3K4me2, H3K4me3 and H4K5ac, and depleted in H3K4me1 and H3K9me2. Our data help clarify the epigenetic specification of DNA replication origins in A. thaliana and have implications for other eukaryotes.


Figures

Figure 1
Figure 1. Identification of DNA replication origins in the Arabidopsis genome
(a) Representative genome-browser view of a region in chromosome 1. Genes (green) transcribed from each strand are shown along the chromosome above and below the position scale. The panels shown in the lower part of the figure correspond to an enlarged region containing a replication origin, determined as a region enriched for BrdU-labeled DNA strands (light blue) relative to the unlabeled control DNA (black), together with the ORC1 (red) and CDC6 (dark blue) binding patterns (posterior probabilities for ORC1 and CDC6 data sets). Origins, e.g. ori1-0850 shown here, are named based on their chromosomal location (ori1- through ori5-) followed by the four digits that indicate the origin number within each chromosome. They are named consecutively starting at the left tip of each chromosome, i.e. for chromosome 1 where we identified 376 origins, the leftmost origin is ori1-0010 and the rightmost one is ori1-3760. (b) The pattern of ORC1 and CDC6 binding over origin regions was obtained by plotting their relative binding signal ±10kb from the origin region midpoint (0) using 50bp-sliding windows (smoothed). The p-values (two-sided) of the difference in the ChIP-chip signals in origins (midpoint ± 300bp), using a two-tailed Welch test, were 7.25e-6 and 1.29e-10 for ORC1 and CDC6, respectively. (c) Number of origins relative to chromosomal size. Chromosome size (relative to chromosome 1) was plotted against the number of origins identified in each chromosome (relative to origin number in chromosome 1). The number of origins identified in each chromosome is indicated in parenthesis. (d) Distribution of interorigin distances, measured as the distance between the midpoints of two contiguous origins (median = 51.1kb; average = 77.2kb; s.d. = 83.4kb).
Figure 2
Figure 2. DNA replication origin activity determined by nascent DNA strand abundance
(a-d) Several putative origin-containing regions were chosen for detailed measurement by real-time PCR of nascent strand abundance in a sample of short DNA molecules containing an RNA primer at their 5’end (see Methods). The genomic region under study is indicated at the bottom of each panel and shows the location of genes (green), the ORC1 binding (red) and CDC6 binding (dark blue) signals, and the putative origin location (light blue), defined by direct sequencing of the BrdU-labeled DNA sample (see Methods). DNA fragments (~200bp in length) amplified by primer pairs scanning each region are indicated by the small black rectangles on the X-axis. The coordinates in each chromosome are also indicated at the bottom of each panel. Results correspond to PCR amplifications using fraction #5 (see Methods). (a-c) Data for origins ori1-2300, ori2-1340 and ori2-1430. (d) Data for a region used as a negative control around gene at4g14700 that lacks BrdU-labeled DNA sequences.
Figure 3
Figure 3. Genomic location of Arabidopsis replication origins
(a) Percentage of origins colocalizing with various genomic elements, as indicated. Numbers in parenthesis indicate the proportion of the Arabidopsis genome represented by each class. (b) Origin densities were computed for regions upstream, downstream, and within genes of different expression levels (all genes vs highest 25% vs lowest 25%). Regions 2kb upstream and downstream of genes, as well as the bodies of genes were each divided into 10 bins, and the origin densities (origins per 106bp) were calculated for each bin and represented as boxplots. White lines represent the median, the edges of the boxes represent the 25th (bottom) and 75th percentiles (top), and the whiskers stretch out to the minimum and maximum points that fell within the 1.5xIQR range below the 25th percentile or above the 75th percentile.
Figure 4
Figure 4. Relationship of Arabidopsis replication origins to CG methylation and histone H2A.Z
(a) Relative levels of CG, CHG and CHH methylation were plotted ±10kb relative to the origin midpoint (0) in 50bp sliding windows (smoothed). Methylation data were published elsewhere . (b) G+C content (%) of replication origins (blue) and the indicated genomic regions (orange). These values were calculated from the sequence data files available at TAIR web site. (c) Density of the histone variant H2A.Z in a ±10kb region relative to the origin midpoint (0) in 50bp sliding windows (smoothed). The genomic distribution of H2A.Z was published elsewhere . The p-value of the difference in the ChIP-chip signals in origins, calculated as in Fig. 1b (see Methods), was 9.34e-34.
Figure 5
Figure 5. Histone modification landscape around replication origins
(a-d) The relative level of the indicated histone mark is plotted ±10kb relative to the center of origins (0) in 50bp sliding windows (smoothed). Data for H3K4me and H3K9me2 were reported elsewhere ,. The p-values of the difference in the ChIP-chip signals in origins, calculated as in Fig. 1b (see Methods), were 0.86, 3.52e-28, 1.07e-41 and 7.33e-14 for H3K4me1, H3K4me2, H3K4me3 and H3K9me2, respectively. (e) Relationship between H3K4 methylation status and the presence of origins. We calculated the fraction of genes containing origins and different combinations of H3K4 methylation, as indicated, and compared it with the fraction of all genes containing the same H3K4me combinations . Different classes are ordered with decreasing values of the fraction of “genes with origins”. (f) The relative level of H4K5ac is plotted ±10kb relative to the center of origins (0) in 50bp sliding windows (smoothed). Calculations are based on the ChIP-chip dataset generated in this work. The p-value of the difference in the ChIP-chip signals in origins, calculated as in Fig. 1b (see Methods), was 1.23e-23.

References

    1. Huberman JA, Riggs AD. On the mechanism of DNA replication in mammalian chromosomes. J Mol Biol. 1968;32:327–341. - PubMed
    1. DePamphilis ML, et al. Regulating the licensing of DNA replication origins in metazoa. Curr. Opin. Cell Biol. 2006;18:231–239. - PubMed
    1. Aladjem MI. Replication in context: dynamic regulation of DNA replication patterns in metazoans. Nat Rev Genet. 2007;8:588–600. - PubMed
    1. Bell SP, Stillman B. ATP-dependent recognition of eukaryotic origins of DNA replication by a multiprotein complex. Nature. 1992;357:128–134. - PubMed
    1. Wyrick JJ, et al. Genome-wide distribution of ORC and MCM proteins in S. cerevisiae: high-resolution mapping of replication origins. Science. 2001;294:2357–2360. - PubMed

Publication types