. 2011 Mar;13(3):331-7.
doi: 10.1038/ncb2175. Epub 2011 Feb 6.

Rapid and efficient clathrin-mediated endocytosis revealed in genome-edited mammalian cells

Affiliations

Rapid and efficient clathrin-mediated endocytosis revealed in genome-edited mammalian cells

Jeffrey B Doyon et al. Nat Cell Biol. 2011 Mar.

Abstract

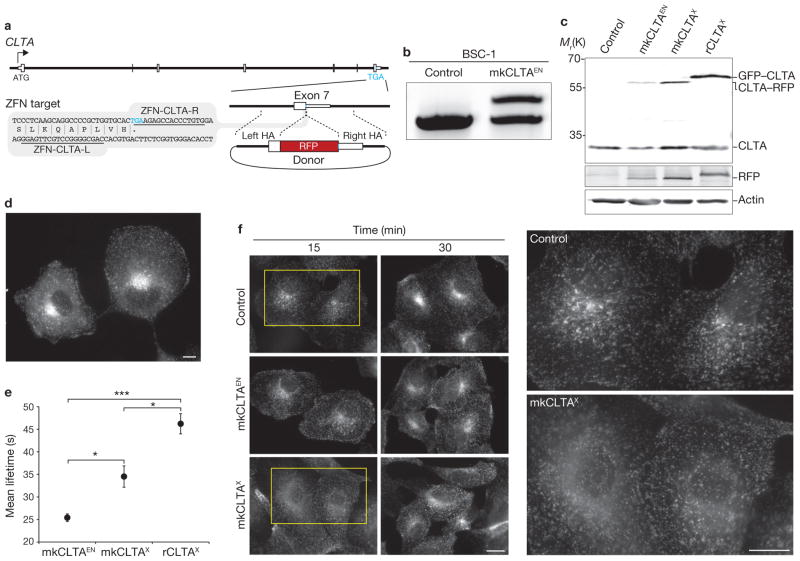
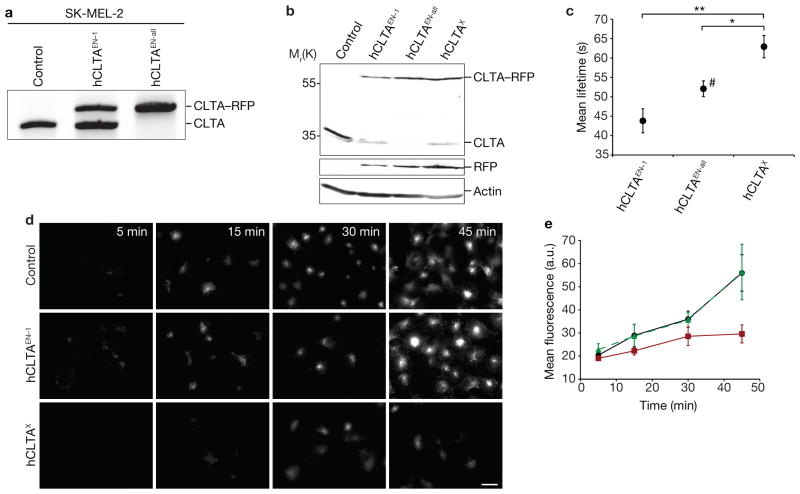
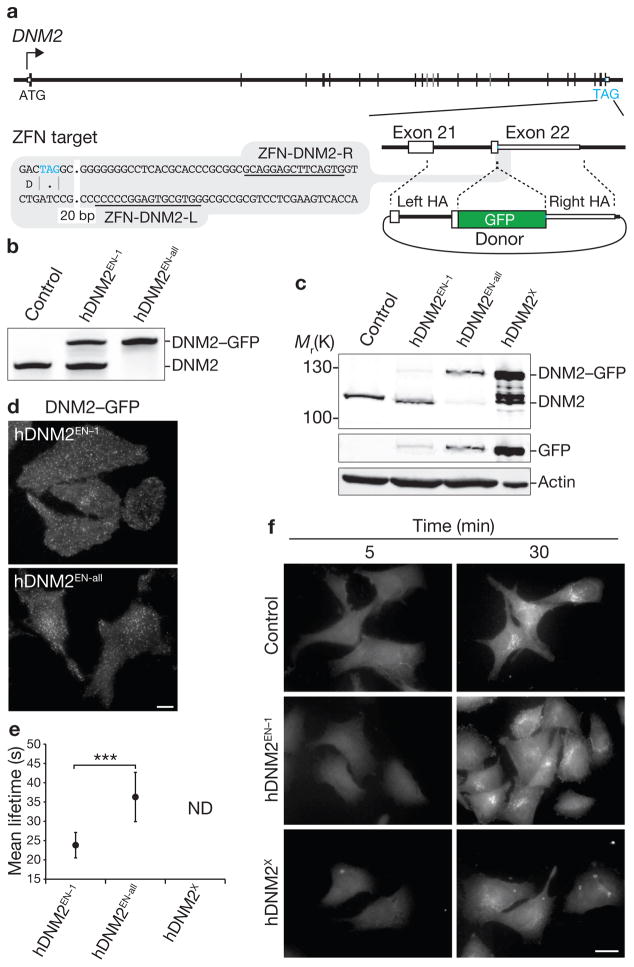
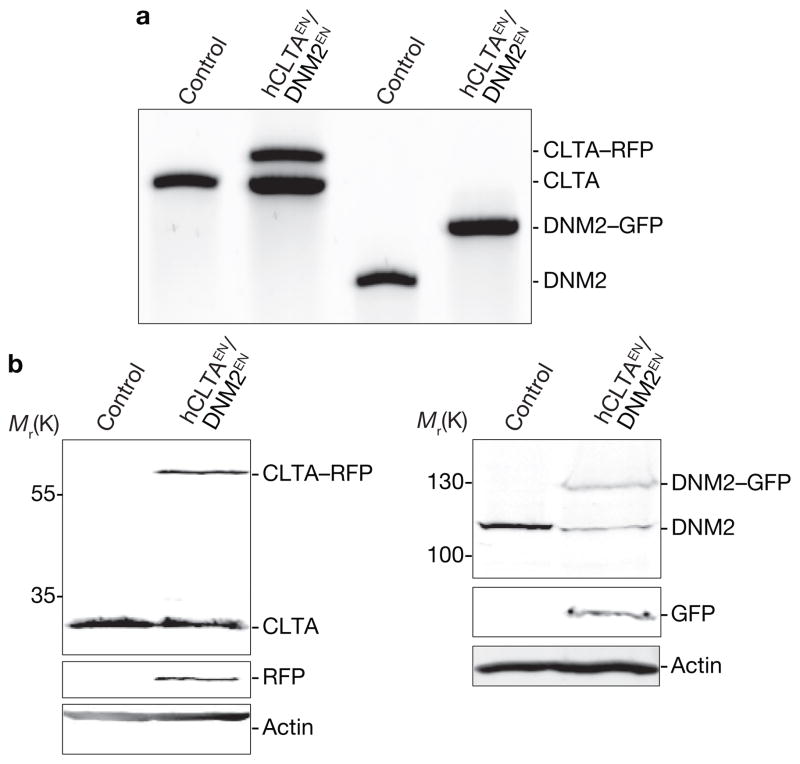
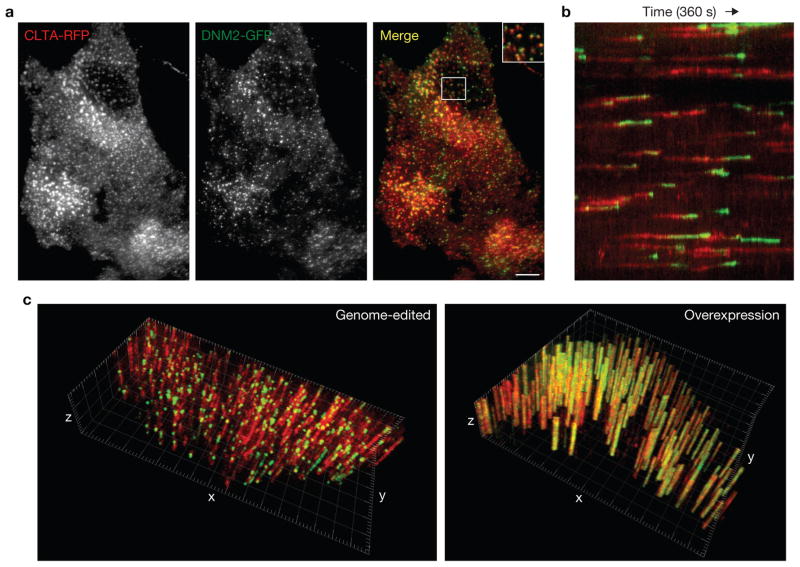
Clathrin-mediated endocytosis (CME) is the best-studied pathway by which cells selectively internalize molecules from the plasma membrane and surrounding environment. Previous live-cell imaging studies using ectopically overexpressed fluorescent fusions of endocytic proteins indicated that mammalian CME is a highly dynamic but inefficient and heterogeneous process. In contrast, studies of endocytosis in budding yeast using fluorescent protein fusions expressed at physiological levels from native genomic loci have revealed a process that is very regular and efficient. To analyse endocytic dynamics in mammalian cells in which endogenous protein stoichiometry is preserved, we targeted zinc finger nucleases (ZFNs) to the clathrin light chain A and dynamin-2 genomic loci and generated cell lines expressing fluorescent protein fusions from each locus. The genome-edited cells exhibited enhanced endocytic function, dynamics and efficiency when compared with previously studied cells, indicating that CME is highly sensitive to the levels of its protein components. Our study establishes that ZFN-mediated genome editing is a robust tool for expressing protein fusions at endogenous levels to faithfully report subcellular localization and dynamics.


Conflict of interest statement

COMPETING FINANCIAL INTERESTS

B.Z., J.M.C., Y.S., A.H.L., T.D.V., Y.D., J.C.M., D.E.P., L.Z., E.J.R., P.D.G. and F.D.U are full-time employees of Sangamo BioSciences, Incorporated.

Figures

Figure 1
Figure 1
Editing of CLTA using ZFNs in BSC-1 cells. (a) Schematic representation of the strategy for integration of RFP at the CLTA locus. White boxes, exons of CLTA; HA, donor plasmid region of homology to CLTA sequence; Blue letters, stop codon. The grey box indicates the region of CLTA exon 7 surrounding the translation stop codon; the underlined sequences indicate the recognition stretches of the individual zinc finger nucleases (ZFN-CLTA-L and ZFN-CLTA-R, respectively). (b) Out-out PCR showing targeted integration of RFP. Control, parental cell line; mkCLTAEN, single-allele CLTA–RFP tagged genome-edited line. (c) Western blot analysis of cell lysates immunoblotted for CLTA, RFP and actin. Note RFP antibody cross-reactivity with GFP. mkCLTAX, stable CLTA–RFP overexpression line; rCLTAX, stable GFP–CLTA (rat brain-derived) overexpression line. (d) Epifluorescence image of mkCLTAEN cells expressing endogenous CLTA–RFP. Scale bar, 10 μm. (e) CCP dynamics were assessed in the indicated BSC-1 cell lines by quantifying the lifetime of fluorescently tagged CLTA proteins at the plasma membrane. Data are means ± s.e.m. Tracks, 30,734–50,250; n = 5, 11 and 15 cells for the mkCLTAX, mkCLTAEN and rCLTAX lines, respectively. Triple asterisk indicates P < 0.0001 and single asterisk indicates P < 0.05. (f) Time course of Alexa Fluor 488-conjugated human transferrin uptake in the indicated BSC-1 cell lines. Areas enclosed by yellow boxes are enlarged (right) for better visualization. Scale bar, 10 μm. Uncropped images of gels and blots are shown in Supplementary Fig. S2a.
Figure 2
Figure 2
Editing of CLTA using ZFNs in SK-MEL-2 cells. (a) Out-out PCR showing targeted integration of RFP. Control, parental cell line; hCLTAEN–1, single-allele CLTA–RFP tagged genome-edited line; hCLTAEN–all, all-allele tagged genome-edited line. (b) Western blot analysis of cell lysates immunoblotted for CLTA, RFP, and actin. hCLTAX, stable CLTA–RFP overexpression line. (c) CCP dynamics were assessed in the indicated cell lines by quantifying the lifetime of CLTA–RFP at the plasma membrane. Data are means ± s.e.m. Tracks, 14,868–19,525; n = 8, 13 and 11 cells (hCLTAEN–1, hCLTAEN–all and hCLTAX, respectively). Double asterisks indicate P < 0.001, single asterisk indicates P < 0.05. #; only diffraction-limited CCPs were analysed, despite the presence of larger, stable clathrin-coated structures. (d) Time course of Alexa Fluor 488-conjugated human transferrin uptake in SK-MEL-2 cell lines. Scale bar, 10 μm. (e) Quantification of cell fluorescence of hCLTAEN–1 cells (green curve; n = 40), compared with parental (black curve; n = 45) and hCLTAX (red curve; n = 21) cell lines from experiment performed as in d. Data are means ± s.d. Uncropped images of gels and blots are shown in Supplementary Fig. S2b.
Figure 3
Figure 3
Editing of DNM2 using ZFNs in SK-MEL-2 cells. (a) Schematic representation of the strategy for integration of GFP at the DNM2 locus. (b) Out-out PCR showing targeted integration of GFP. Control, parental cell line; hDNM2EN–1, single-allele tagged genome-edited line; hDNM2EN–all, all-allele tagged genome-edited line. (c) Western blot analysis of cell lysates immunoblotted for DNM2, GFP or actin. hDNM2X, stable overexpression DNM2–GFP cell line. (d) TIRF microscopy images of genome-edited hDNM2EN cell lines expressing DNM2–GFP. Scale bar, 10 μm. (e) Lifetime of DNM2–GFP at the plasma membrane in the indicated cell lines. Data are means ± s.e.m. Tracks, 14,726 or 29,681; n = 10 and 13 cells (hDNM2EN–1 and hDNM2EN–all, respectively). Asterisks indicate P < 0.0001. Not determined (ND) denotes an inability to perform lifetime analysis owing to the presence of stable, non-diffraction-limited dynamin structures. (f) Time course of Texas-Red-conjugated human transferrin uptake in SK-MEL-2 cell lines. Scale bar, 10 μm. Uncropped images of gels and blots are shown in Supplementary Fig. S2c.
Figure 4
Figure 4
Simultaneous editing of both CLTA and DNM2 using ZFNs in SK-MEL-2 cells. (a) Out-out PCR of a single-cell-derived clone showing targeted integration of RFP and GFP into the CLTA and DNM2 loci, respectively. Control, parental cell line; hCLTAEN/DNM2EN, single-allele tagged CLTA–RFP and all-allele tagged DNM2–GFP genome-edited line. (b) Western blot analysis of cell lysates immunoblotted for CLTA, DNM2, GFP, RFP or actin. Uncropped images of gels and blots are shown in Supplementary Fig. S2d.
Figure 5
Figure 5
Fluorescence microscopy analysis of the hCLTAEN/DNM2EN cell line. (a) TIRF microscopy image of the hCLTAEN/DNM2EN cell line expressing both CLTA–RFP and DNM2–GFP. The top right of merged image is a higher magnification view of indicated area. Scale bar, 10 μm. (b) Kymograph analysis of CLTA–RFP and DNM2–GFP fluorescence over time. (c) Three-dimensional kymograph analysis of the genome-edited hCLTAEN/DNM2EN cell line (left), compared with a SK-MEL-2 cell transiently overexpressing CLTA–RFP and DNM2–GFP (right). xy plane (2.5 μm2 grid), cell plasma membrane; z axis, time (240 s, 2 s per slice).

References

    1. Merrifield CJ, Feldman ME, Wan L, Almers W. Imaging actin and dynamin recruitment during invagination of single clathrin-coated pits. Nat Cell Biol. 2002;4:691–698. - PubMed
    1. Pucadyil TJ, Schmid SL. Real-time visualization of dynamin-catalyzed membrane fission and vesicle release. Cell. 2008;135:1263–1275. - PMC - PubMed
    1. Roux A, Uyhazi K, Frost A, De Camilli P. GTP-dependent twisting of dynamin implicates constriction and tension in membrane fission. Nature. 2006;441:528–531. - PubMed
    1. Goldstein JL, Brown MS. The low-density lipoprotein pathway and its relation to atherosclerosis. Annu Rev Biochem. 1977;46:897–930. - PubMed
    1. Zuchner S, et al. Mutations in the pleckstrin homology domain of dynamin 2 cause dominant intermediate Charcot-Marie-Tooth disease. Nat Genet. 2005;37:289–294. - PubMed

Publication types