. 2011 Mar 1;369(1-2):119-129.
doi: 10.1016/j.memsci.2010.11.056.

An experimental and theoretical analysis of molecular separations by diffusion through ultrathin nanoporous membranes

Affiliations

An experimental and theoretical analysis of molecular separations by diffusion through ultrathin nanoporous membranes

J L Snyder et al. J Memb Sci. .

Abstract

Diffusion based separations are essential for laboratory and clinical dialysis processes. New molecularly thin nanoporous membranes may improve the rate and quality of separations achievable by these processes. In this work we have performed protein and small molecule separations with 15 nm thick porous nanocrystalline silicon (pnc-Si) membranes and compared the results to 1- and 3- dimensional models of diffusion through ultrathin membranes. The models predict the amount of resistance contributed by the membrane by using pore characteristics obtained by direct inspection of pnc-Si membranes in transmission electron micrographs. The theoretical results indicate that molecularly thin membranes are expected to enable higher resolution separations at times before equilibrium compared to thicker membranes with the same pore diameters and porosities. We also explored the impact of experimental parameters such as porosity, pore distribution, diffusion time, and chamber size on the sieving characteristics. Experimental results are found to be in good agreement with the theory, and ultrathin membranes are shown to impart little overall resistance to the diffusion of molecules smaller than the physical pore size cutoff. The largest molecules tested experience more hindrance than expected from simulations indicating that factors not incorporated in the models, such as molecule shape, electrostatic repulsion, and adsorption to pore walls, are likely important.


Figures
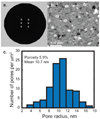
Figure 1
Figure 1
Pnc-Si membrane. (a.) 6.5 mm diameter silicon chip with six 0.2 × 0.2 µm freestanding pnc-Si membrane material. (b.) TEM micrograph of nanometer scale pores in 15 nm thick pnc-Si membrane film. Pores are white ellipsoids and nanocrystals are black spots. (c.) Pore characteristics as determined from image processing of 2 µm squared micrograph of the membrane in panel (b.).
Figure 2
Figure 2
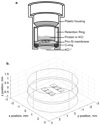
Experimental setup and 3-D computational diffusion model. (a.) Schematic of experimental setup. (b.) CAD model of experimental system: 6 windows terminated in 15 nm thick membrane material separate two fluid wells.
Figure 3
Figure 3
Experimental Results. (a.) SDS-PAGE of 24 hour protein separation. As proteins get smaller in size, they diffuse through the membrane to a greater extent. Myosin serves as an intact membrane control. (b.) Mass balance performed by normalizing retentate and dialysate SDS-PAGE gel band intensity to band intensity of starting sample. (c.) Absorbance scans of rhodamine 6g 24 hour diffusion. (d.) Sieving coefficients from experimental proteins and small molecules for a 24 hour separation with molecule sizes determined by DLS. (Myo - myosin, β-gal - β-galactosidase, Phos-b -phosphorylase-b, Alb - albumin, Ovalb - ovalbumin, Carb - carbonic anhydrase, Cyt-c - cytochrome c, R6G - rhodamine 6g)
Figure 4
Figure 4
Components of resistance for thin and thick membranes with 15 nm pores and comparison to fluid well resistance. (a.) Resistances for an ultrathin (15 nm) membrane. For small molecules, the transmembrane and pore discovery resistances are similar. The addition of the two create a larger total resistance. At molecule sizes approaching the pore size, the transmembrane permeability dominates the total resistance. (b.) Resistances for a thick (5 µm) membrane. Transmembrane resistance is the dominating resistance for all molecule sizes and overlaps with the total resistance in this panel. The pore discovery resistance has the same values as in panel a., though is too small in comparison to be viewed. (c.) Comparison of well resistance and membrane resistance for thick and ultrathin membranes. Due to the high transmembrane resistance in thick membranes, the total membrane resistance surpasses the fluid well resistance at much smaller molecule sizes than the ultrathin membrane case.
Figure 5
Figure 5
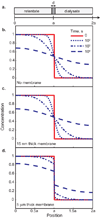
Concentration profiles in 1-D model. (a.) Schematic of 1-D analytic model: retentate and dialysate fluid wells are separated by a membrane of thickness d. (b.) In a simulation without a membrane, a 5 nm radius molecule diffuses into the dialysate well (a = 1 mm) based on its free diffusion coefficient. (c.) In the case of an ultrathin (15 nm thick) membrane, in which the 5 nm radius molecule is significantly smaller than the largest pores in the distribution (Fig. 1c), the diffusion is indistinguishable from the no membrane case. (d.) If a thick (5 µm) membrane with the same pore radii and porosity separate the wells, the diffusion is hindered, as indicated by the large concentration jump across the membrane and the slower approach to equilibrium.
Figure 6
Figure 6
Sieving profiles of 15 nm thick and 5 µm thick membranes for 1, 6, and 24 hour time points. Both 15 nm and 5 µm thick membranes have a pore radius cutoff of 10 nm. A no membrane (free diffusion) simulation at each time point is shown for comparison. For small molecules, the diffusion through the thin membrane is indistinguishable from free diffusion. Diffusion through the thin membrane slows as the molecules approach the pore cutoff. The thick membrane shows strong hindrance at all molecule sizes, raising the time to equilibrium and lowering the resolution of the separation.
Figure 7
Figure 7
Factors that influence separations by ultrathin membranes. Here we plot sieving coefficients normalized to sieving coefficients obtain from a membraneless separation (free diffusion case), Smem/S0, for a series of molecule sizes. This normalized sieving profile shows the extent to which hindrance by the membrane influences the separations. Except for the particular factor being adjusted, the separations are for a 15 nm thick membrane with 5% porosity and 10 nm radius pores for a 1 hour separation in a system with 1 mm fluid wells. The dotted line represents equilibrium (time > 100 days). (a.) Lowering porosity increases the influence of the membrane on molecules below the 10 nm cutoff. A 5 µm thick membrane is included for comparison. (b.) Small pores do not change the normalized sieving profile for 15 nm thick membranes. Adding more small pores to a thick membrane has some effect on the sieving profile. Separations with thin membranes are thus governed by the pores close to the physical pore cutoff, while the entire distribution of the membrane affects the separations for thick membrane. (c.) The membrane has a greater affect on the normalized sieving profile at shorter time scales. This occurs because slight hindrance differences are significant at short times (d.) Smaller wells reach equilibrium faster but are more sensitive to the membrane. Profiles are shown in each case at a characteristic time to equilibrium 0.4τ, where τ = a2/D0.
Figure 8
Figure 8
Slice through 3-D model after 10 hours of diffusion of a 5 nm radius molecule. Concentration isolines show diffusion through the membrane (at z position 0) from the retentate (top) to the dialysate (bottom).
Figure 9
Figure 9
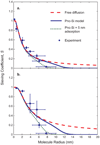
Experimental and 3-D model sieving profiles for pnc-Si separations at (a.) 24 and (b.) 48 hours using DLS sizing for experimental data. The sieving profile (solid line) deviates from free diffusion (dashed line) near the physical pore size cutoff. The largest molecules deviate from the theoretical sieving profile. We plot at additional simulation with an added 5 nm protein adsorption ring to the pores, and this adjustment fits the data for both 24 and 48 hours.

References

    1. Luque de Castro MD, Priego Capote F, Sánchez Ávila N. Is dialysis alive as a membrane-based separations technique? TrAC, Trends Anal. Chem. 2008;27:315.
    1. Fissell WH, Humes HD, Fleischman AJ, Roy S. Dialysis and nanotechnology: now, 10 years, or never? Blood Purif. 2007;25:12. - PubMed
    1. Mochizuki S, Zydney AL. Theoretical analysis of pore size distribution effects on membrane transport. J. Mem. Sci. 1993;82:211.
    1. Vanholder R, Glorieux G, Van Biesen W. Advantages of new hemodialysis membranes and equipment. Nephron Clin. Pract. 2010;114:c165. - PubMed
    1. Jadoul M. Dialysis-related amyloidosis: importance of biocompatibility and age. Nephrol. Dial. Transpl. 1998;13:61. - PubMed

LinkOut - more resources