. 2011 Jan 28;6(1):e16330.
doi: 10.1371/journal.pone.0016330.

Genome-wide analysis of transcriptional reprogramming in mouse models of acute myeloid leukaemia

Affiliations

Genome-wide analysis of transcriptional reprogramming in mouse models of acute myeloid leukaemia

Nicolas Bonadies et al. PLoS One. .

Abstract

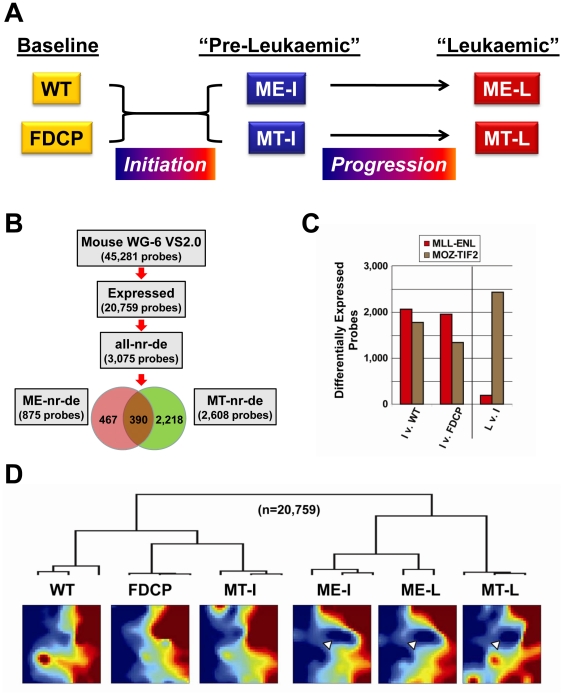
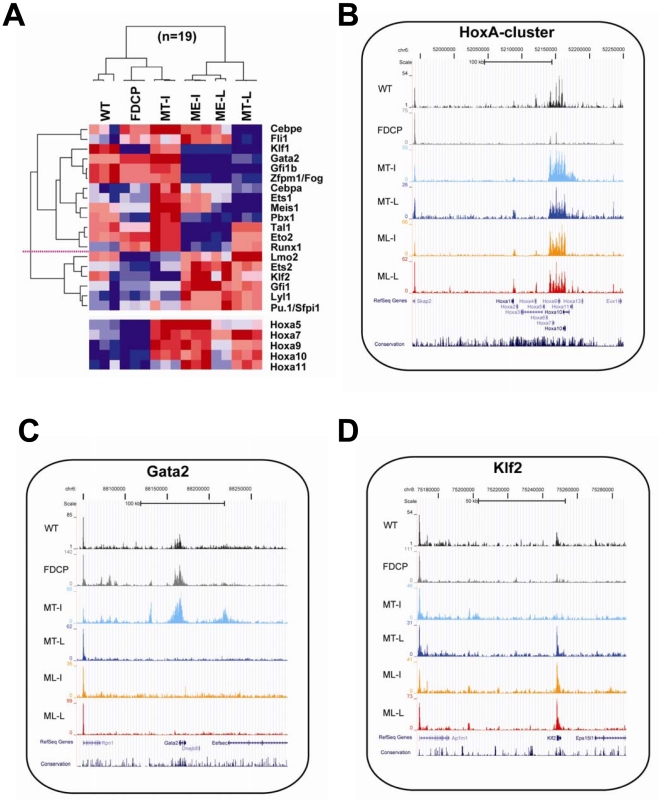
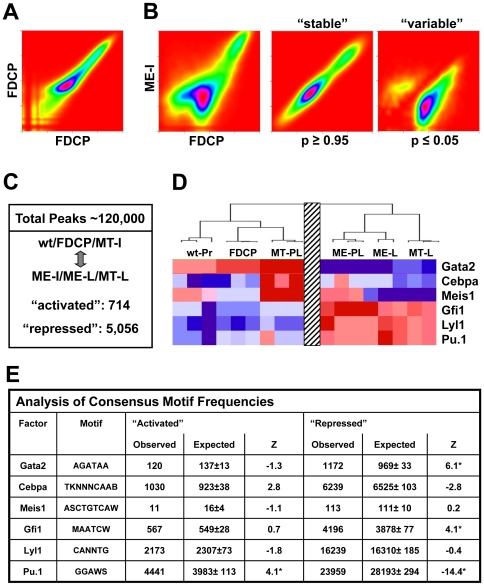
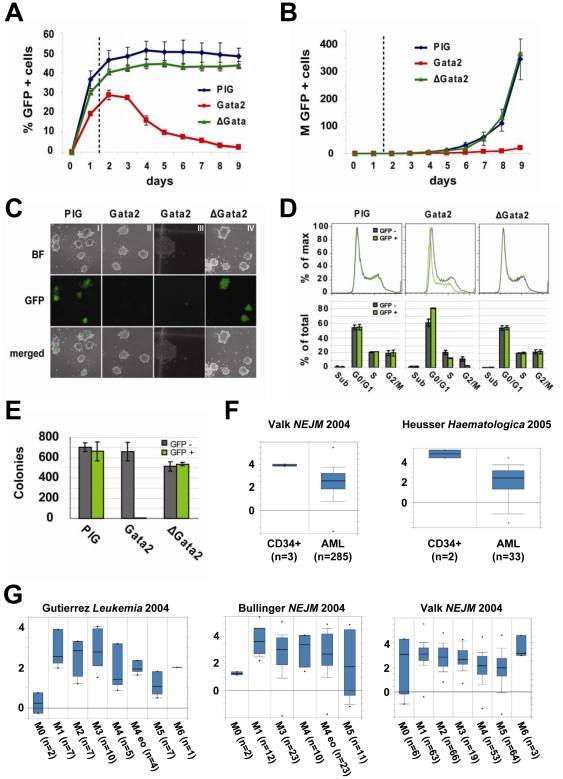
Acute leukaemias are commonly caused by mutations that corrupt the transcriptional circuitry of haematopoietic stem/progenitor cells. However, the mechanisms underlying large-scale transcriptional reprogramming remain largely unknown. Here we investigated transcriptional reprogramming at genome-scale in mouse retroviral transplant models of acute myeloid leukaemia (AML) using both gene-expression profiling and ChIP-sequencing. We identified several thousand candidate regulatory regions with altered levels of histone acetylation that were characterised by differential distribution of consensus motifs for key haematopoietic transcription factors including Gata2, Gfi1 and Sfpi1/Pu.1. In particular, downregulation of Gata2 expression was mirrored by abundant GATA motifs in regions of reduced histone acetylation suggesting an important role in leukaemogenic transcriptional reprogramming. Forced re-expression of Gata2 was not compatible with sustained growth of leukaemic cells thus suggesting a previously unrecognised role for Gata2 in downregulation during the development of AML. Additionally, large scale human AML datasets revealed significantly higher expression of GATA2 in CD34+ cells from healthy controls compared with AML blast cells. The integrated genome-scale analysis applied in this study represents a valuable and widely applicable approach to study the transcriptional control of both normal and aberrant haematopoiesis and to identify critical factors responsible for transcriptional reprogramming in human cancer.


Conflict of interest statement

Competing Interests: The authors have declared that no competing interests exist.

Figures

Figure 1
Figure 1. Gene-expression dynamics during MLL-ENL and MOZ-TIF2 mediated reprogramming.
A). Diagram outlining how samples collected for expression profiling and ChIP-sequencing constitute a leukaemia progression model. B) Flow chart of gene-expression analysis. 20,759 of the 45,281 probes represented on the array (45.8%) were found to be expressed in at least one sample (detection p-value >0.01). Differential expression analysis was performed for six representative pair-wise comparisons, as summarized in Table S1 in Supporting Information S1. Non-redundant, differentially expressed probes (nr-de) were determined as outlined in Figure S2 in Supporting Information S1: 857 probes for MLL-ENL (ME-nr-de probes) and 2,608 for MOZ-TIF2 (MT-nr-de probes) corresponded to 3,075 non-redundant probes differentially expressed in at least one of the transitions (all-nr-de probes). C) Bar-charts of differentially expressed probes in six relevant pair-wise comparisons. Y-axis shows the total number of differentially expressed probes, as outlined in Table S1 in Supporting Information S1, for the “Initiation” (WT/FDCP vs ME-I/MT-I) and the “Progression” to overt leukaemia (ME-I/MT-I vs ME-L/MT-L). D) Unsupervised hierarchical clustering (UHC) correlates with Gene Expression Dynamics Inspector (GEDI) maps. All 20,759 expressed probes were clustered, as shown in the dendrogram on the top of the figure, and dynamic expression changes visualized with GEDI maps. Mean expression values of probes with similar dynamic patterns are condensed by self organizing maps in expressed (red) and repressed (blue) tiles and proximity of adjacent tiles indicates similar dynamics . UHC and GEDI identified a ‘non-leukaemic’ cluster, containing the WT, FDCP and MT-I samples, and a ‘leukaemic’ cluster, comprising the ME-I, ME-L and the MT-L samples. A group of co-ordinately downregulated probes seen in the ME-I, ME-L and MT-L samples is indicated by white arrowheads.
Figure 2
Figure 2. Dynamic changes of HSPC transcription factors during MLL-ENL and MOZ-TIF2 induced reprogramming.
A) Hierarchical clustering of 19 dynamically expressed HSPC transcription factors. For comparison, dynamic expression changes of 5 abdominal HoxA-cluster genes are depicted as a heatmap at the bottom of the figure but were not included for the clustering analysis. Clusters of repression and activation could be distinguished and are separated by a horizontal dotted red line. B) Dynamic changes of histone H3K9 acetylation (H3K9ac) at the HoxA-cluster gene-locus. ChIP-Seq traces are displayed on the UCSC genome browser for one representative biological replicate of the six conditions under investigation (WT, FDCP, MT-I, MT-L, ME-I, ME-L). C) Dynamic changes of H3K9ac at the Gata2 gene-locus. Down-regulation of Gata2 expression is paralleled by reduced acetylation marks. D) Dynamic changes of H3K9ac at the Klf2 gene-locus. Up-regulation of Klf2 expression is paralleled by increased acetylation marks.
Figure 3
Figure 3. Over-representation of consensus binding motifs from differentially expressed HSPC transcription factors within most variable H3K9ac candidate regulatory regions.
A) Kernel Density Estimation Plots (heat-maps) of relative H3K9ac peak-scores from biological replicates used for analysis of leukaemogenic progression in MLL-ENL. Peak scores are depicted as colour-coded heat-maps for the two FDCP biological replicates. Most datapoints lie on a diagonal suggesting good correlation between biological replicates. B) Heat-maps of relative H3K9ac peak-scores for the FDCP/ME-I ‘Initiation’ comparison as well as depiction of “stable” and “variable” regions (T-test: p≤0.05). Variable regions were clearly divided into enriched (above 45° axis) and deprived (below 45° axis) regions. C) Summary of dynamically changing H3K9ac candidate regulatory regions for the wt/FDCP/MT-I v. ME-I/ME-L/MT-L comparison. D) Expression profile for selected HSPC TFs across the wt/FDCP/MT-I v. ME-I/ME-L/MT-L comparison (derived from Fig. 2A). E) Observed and expected frequencies of 6 consensus-motifs in most variable H3K9ac candidate regulatory regions from C). Significantly increased and reduced peak-regions were used for the detection of differentially distributed motifs using bootstrap analysis with 1000 sets of background sequences (see methods). Significant under/over-representation was defined by a Z-score of ≤−3 or ≥+3 (indicated by a *).
Figure 4
Figure 4. Gata2 over-expression interferes with cell-cycling and is incompatible with sustained proliferation of MLL-ENL transduced cells.
A) Fraction of GFP-positive cells monitored in a competitive proliferation assay performed in liquid culture over a time-course of 9 days. ME-I cells were transduced with pMSCV-Pgk-Puro-IRES-GFP (PIG), pMSCV-Gata2-Pgk-Puro-IRES-GFP (Gata2) and pMSCV-ΔGata2-Pgk-Puro-IRES-GFP (ΔGata2). Vector constructs are outlined in Figure S9A and B in Supporting Information S1. X-axis depicts days after transduction, y-axis the GFP-positive cell-fraction (% of total viable cells). GFP-positive and GFP-negative cells of each sample were analysed together without prior FACS-sorting. Results from two independent experiments (mean ± SD) are shown. Subsequent analysis (Figure 4D) was performed 36 hours after transduction (indicated by the dotted line). B) Growth curves show that Gata2 overexpression is incompatible with sustained proliferation of ME-I cells. X-axis depicts days after transduction, y-axis the total GFP-positive cell-number (in millions) determined from the GFP-positive fraction and the total number of viable cells. Results from two independent experiments (mean ± SD) are shown. C) Representative pictures of colony-formation in a competitive proliferation assay performed in semi-solid culture. ME-I cells were transduced with PIG, Gata2 and ΔGata2 and 104 cells transferred to methylcellulose after 36 hours. Images were taken after 4 days under bright-field (BF) and with GFP fluorescent light (GFP) and merged with 10x magnifications (except section III, which was taken at 20x magnification). D) Cell-cycle analysis of GFP-positive and GFP-negative cells 36 hours after transduction. The upper panel depicts a representative cell-cycle plot of GFP-positive and GFP-negative ME-I cells after transduction with PIG, Gata2 and ΔGata2. Note that GFP-positive and GFP-negative cells of each sample were analysed together without prior FACS-sorting, providing an internal control for gating and settings of the instrument. X-axis shows PI fluorescence intensities, y-axis % of maximal counts. The lower panel depicts % of total counts in sub-G0/G1 (sub), G0/G1, S and G2/M-phase as determined by the cell-cycle plot for GFP-positive and GFP-negative cells. Results from two independent experiments (mean ± SD) demonstrated statistically significant alterations for the Gata2 transduced cells (sub, p = 0.97; G0/G1, p = 0.033; S, p = 0.068; G2M, p = 0.041; two-tailed t-test). E) Bar-chart of numbers of GFP-positive and GFP-negative colonies from C). Results from two independent experiments (mean ± SD) are shown. F) Comparison of GATA2 expression from published human AML microarray datasets performed with Oncomine (http://www.oncomine.org) . Boxes display median expression values and contain data from the 25th to 75th percentiles with the bars representing the 10th and 90th percentiles respectively. Y-axis show log2 median centered ratios. The Valk et al dataset (GEO accession number: GSE1159) shown on the left shows relatively high GATA2 expression in CD34+ control cells when compared with bone marrow samples from 285 AML-patients (probe H00625, note that 10th percentile of the CD34 samples is higher than the 90th percentile of the AML samples, thus indicating a significant difference in expression levels). The Heuser et al dataset (GEO accession number: GSE4137) on the right similarly shows significantly higher levels of GATA2 in CD34+ cells from two healthy controls compared to blood and bone marrow samples from 33 AML-patients prior induction chemotherapy. G) Oncomine analysis of three independent gene expression datasets (GEO accession numbers: GSE1729, GSE425, GSE1159) , , demonstrates that GATA2 expression levels are not higher in AML subtypes characterised by minimal differentiation (FAB AML-M0).

References

    1. Hanahan D, Weinberg RA. The hallmarks of cancer. Cell. 2000;100:57–70. - PubMed
    1. Melnick AM, Adelson K, Licht JD. The theoretical basis of transcriptional therapy of cancer: can it be put into practice? J Clin Oncol. 2005;23:3957–3970. - PubMed
    1. Rabbitts TH. Chromosomal translocations in human cancer. Nature. 1994;372:143–149. - PubMed
    1. Look AT. Oncogenic transcription factors in the human acute leukemias. Science. 1997;278:1059–1064. - PubMed
    1. Kennedy JA, Barabe F. Investigating human leukemogenesis: from cell lines to in vivo models of human leukemia. Leukemia. 2008;22:2029–2040. - PubMed

Publication types