

Discovering conformational sub-states relevant to protein function
- PMID: 21297978
- PMCID: PMC3030567
- DOI: 10.1371/journal.pone.0015827
Discovering conformational sub-states relevant to protein function
Abstract
Background: Internal motions enable proteins to explore a range of conformations, even in the vicinity of native state. The role of conformational fluctuations in the designated function of a protein is widely debated. Emerging evidence suggests that sub-groups within the range of conformations (or sub-states) contain properties that may be functionally relevant. However, low populations in these sub-states and the transient nature of conformational transitions between these sub-states present significant challenges for their identification and characterization.
Methods and findings: To overcome these challenges we have developed a new computational technique, quasi-anharmonic analysis (QAA). QAA utilizes higher-order statistics of protein motions to identify sub-states in the conformational landscape. Further, the focus on anharmonicity allows identification of conformational fluctuations that enable transitions between sub-states. QAA applied to equilibrium simulations of human ubiquitin and T4 lysozyme reveals functionally relevant sub-states and protein motions involved in molecular recognition. In combination with a reaction pathway sampling method, QAA characterizes conformational sub-states associated with cis/trans peptidyl-prolyl isomerization catalyzed by the enzyme cyclophilin A. In these three proteins, QAA allows identification of conformational sub-states, with critical structural and dynamical features relevant to protein function.
Conclusions: Overall, QAA provides a novel framework to intuitively understand the biophysical basis of conformational diversity and its relevance to protein function.
Conflict of interest statement
Figures
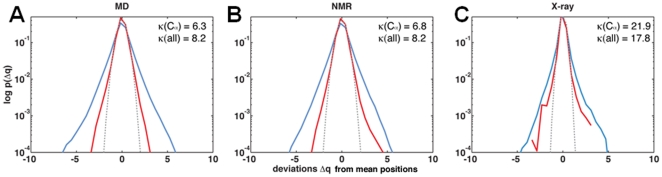
 ) from the mean position was calculated at 50 ps intervals. The same bin size (0.54 Å) was used for all histograms. Dotted curve shows a Gaussian fit to the C
 distribution. The probability distributions of positional deviations [
 ] are plotted in log-scale.
 atom exhibiting anharmonic fluctuations. Note that functionally relevant regions in ubiquitin forming primary (
 and
and  called R1 collectively) and secondary binding interfaces (
 called R2 and
  ) spend relatively a large fraction of the time exhibiting anharmonic fluctuations. (B) illustrates which regions of the protein exhibit
  (Gaussian),
  (sub-Gaussian) and
  (super-Gaussian) motions. Note that the protein is predominantly anharmonic.
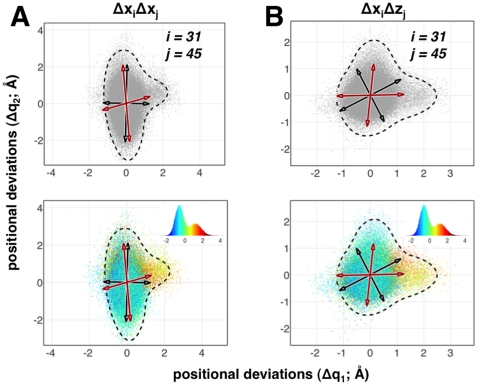
 atom's
  and
and  (A) and
  and
and  (B) directions for the residue pair 31 and 45. The black arrows represent the directions from QHA whereas the red arrows represent the directions from QAA. Note that only the non-orthogonal QAA directions align well with the natural orientation of the data. QHA directions, which are orthogonal, do not model this distribution well. Lower panels illustrate the energetic coupling in pair-wise distributions. QAA directions are biophysically relevant as they point to directions where the high-energy states exist. The corresponding energy distributions of the pair-wise interactions (non-bonded electrostatic and van der Waals) are shown in respective insets. Although illustrated for a particular residue pair, a thorough comparison of positional fluctuations also reveals that this intrinsic non-orthogonality occurs throughout the protein. The dotted line in these plots represent the extent of these joint distributions, highlighting the anharmonicity in positional fluctuations for the residues considered here.
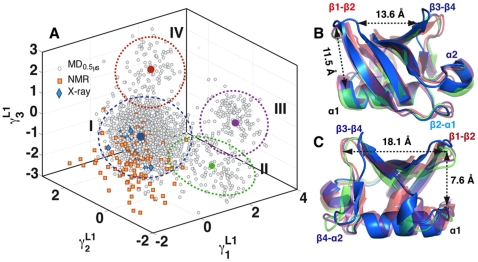
 ,
,  and
and  . Level 1 (L1) indicates the level of the hierarchy. The projection (units Å) shows four distinct clusters (I-IV). The clusters were identified using a mixture of Gaussian (MoG) model, with boundaries marked by ellipses drawn 3 standard deviations (
 ) from the respective cluster centers. The cluster centers are shown in blue (7,880 conformers; I) green (773; II), purple (692; III) and red (655; IV). The X-ray ensemble consisting of 44 crystal structures is shown as blue diamonds; 42 of these structures are covered within 2
 of cluster I. The
  s time-scale NMR ensemble consisting of 116 conformers are shown as orange squares; 78 conformers lie with 3
 deviations from cluster I, indicating that the MD sampling has visited most bound/unbound conformations in the space spanned by
  ,
,  and
and  . (B and C). Two different view-points (rotated around y-axis by 180°) of the mean conformations from each cluster (bold circles in A) show significant structural deviations in R1 and R2. The distance between centroids of R1 and R2 are shown here for reference. In cluster I, the average distance between R1 is only 13.6 Å where as in the other three clusters (II, III and IV), the distance is 18.1 Å. The distance between R1 and R2 is maximum in cluster I (11.5 Å), where as decreases to about 7.5 Å in clusters II, III and IV.
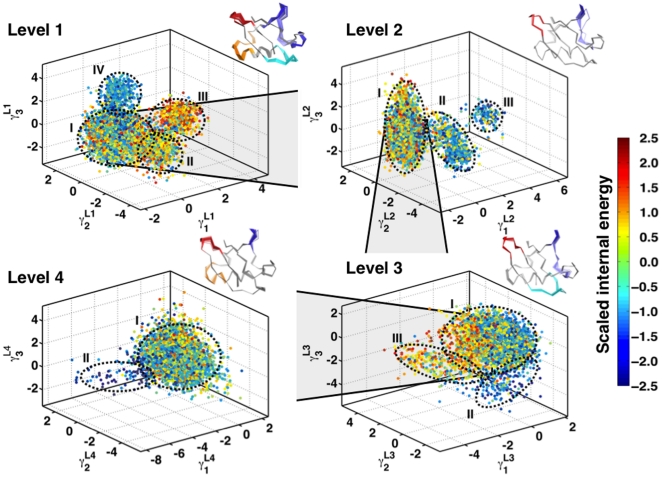
 ) are illustrated in each panel in a movie like representation, showing only the C
 trace of the protein (see SI Movies). The primary and secondary binding regions
  ,
,  ,
,  and
and  are highlighted in red, cyan, orange and blue respectively to highlight large-scale fluctuations in these regions. While in Level 1 the motions are global - involving the entire protein, Levels 2, 3 and 4 show subsequent localization of motions, as evidenced by their relative decrease in amplitude. The motions in each level involve well defined transitions from a relatively heterogenous population to a energetically homogenous sub-state. These motions have implications in ubiquitin recognizing multiple binding partners , .
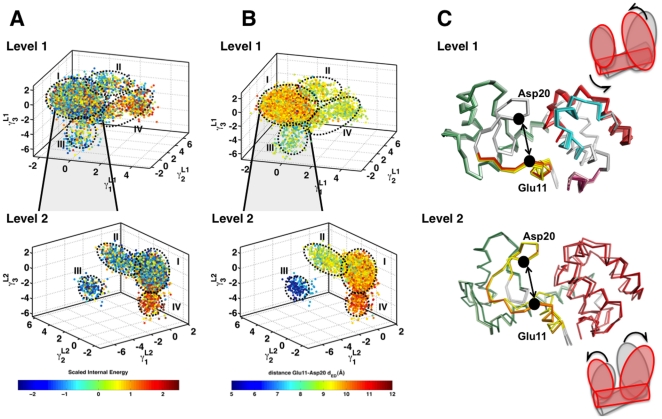
 ,
,  and
and  ) for each level of the hierarchy. Only two levels of the hierarchy are shown. Each conformer is painted with the scaled internal energy described in the text. (B) To validate QAA can extract suitable order parameters, we painted each level of the hierarchy with an order parameter
  defined as the distance between the C
 distance between catalytically important residues: Glu11 and Asp20. As illustrated, each conformational sub-state shares a remarkable similarity in the defined order parameters. In Level 1, sub-states II, III and IV share relatively smaller distance in between the catalytic sites; in Level 2, there is a clear separation in between the catalytic sites. (C) Beside each level, the motions involved in the first (
 ) anharmonic mode is shown in a movie-like fashion. The frames of the movie (see SI movies) are colored according to the internal energy of the protein; darker shades represent higher-energy conformers. In Level 1, as shown in the cartoon-like representation at the top, we observe large-scale fluctuations in the larger lobe of the protein and the helix (shown in green), where as in Level 2, the motions are along both the lobes of the protein.
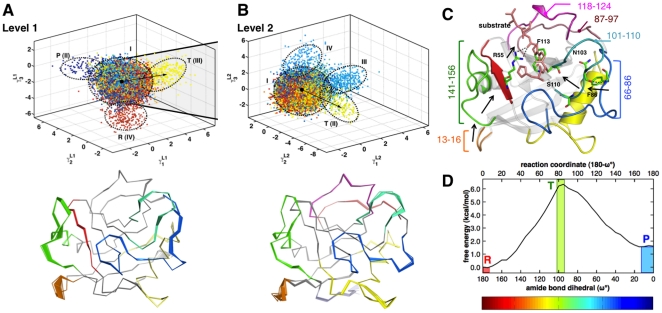
 ). Note the separation between the ground-state conformers (cluster II) and transition state conformers (cluster III). Observe that flexible loops 12–15, 26–40, 54–60, 66–76 and 101–110 show relatively large motions leading to the transition state. Most of these regions have also been previously implicated in enabling catalysis by allowing the enzyme and substrate peptide to interact favorably so that the isomerization can proceed further. (B) In Level 2 (top panel), motions leading to the transition state activate complementary regions in addition to motions observed in Level 1. Note that the motions in the flexible loops highlighted in Level 1 undergo lower amplitude motions; however, flexible loops 77–96, 120–126 show pronounced fluctuations at this level. Note that in both (A) and (B), the color scale from the amide bond dihedral is used to paint the conformers; the transition state conformers are painted in light green. (C) The coupling observed confirms previous studies which identifies a network of coupled motions extending from the flexible surface regions all the way to the active site connected by hydrogen bonds. Note the motions of Phe83 and Asn103 are critical for enzyme function. (D) shows the free-energy profile for the cis/trans isomerization of the bound peptide.
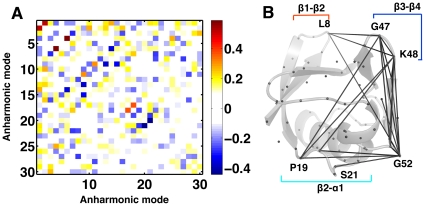
 ). (B) An example of anharmonic coupling between modes 1 and 2 (
 ) for ubiquitin shows spatially coupled regions in the protein. Observe the long-range coupling between R1 and
  . C
. C atoms are shown as gray spheres and residues commonly activated by modes 1 and 2 are marked and connected by gray lines.
References
-
- Cannon WR, Benkovic SJ. Solvation, reorganization energy, and biological catalysis. J Biol Chem. 1998;273:26257–26260. - PubMed
-
- Henzler-Wildman K, Kern D. Dynamic personalities of proteins. Nature. 2007;450:964–972. - PubMed
-
- Markwick PRL, Bouvignies G, Blackledge M. Exploring multiple timescale motions in protein GB3 using accelerated molecular dynamics and NMR spctroscopy. J Am Chem Soc. 2007;129:4724–4730. - PubMed
-
- Elber R, Karplus M. Multiple conformational states of proteins: A molecular dynamics analysis of myoglobin. Science. 1987;235:318–321. - PubMed
Publication types
MeSH terms
Substances
Grants and funding
LinkOut - more resources
Full Text Sources
Other Literature Sources
