. 2011 Jan 28;6(1):e16307.
doi: 10.1371/journal.pone.0016307.

Abnormal kinetochore-generated pulling forces from expressing a N-terminally modified Hec1

Affiliations

Abnormal kinetochore-generated pulling forces from expressing a N-terminally modified Hec1

Marta Mattiuzzo et al. PLoS One. .

Abstract

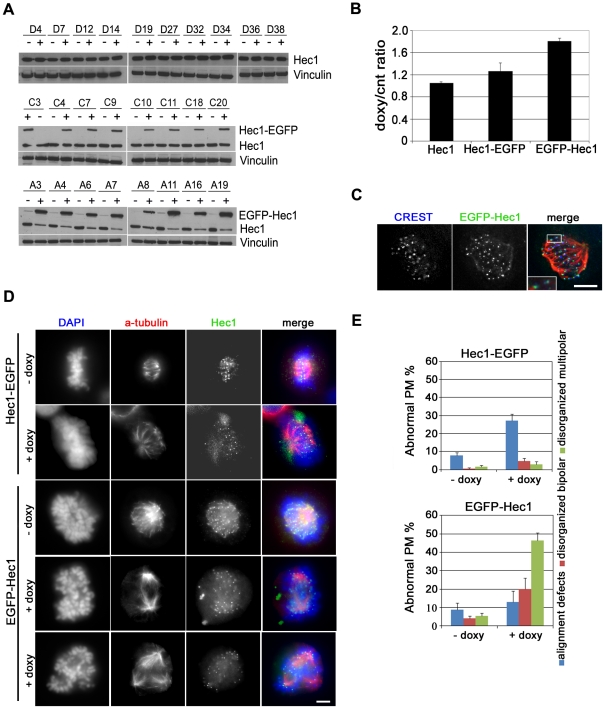
Background: Highly Expressed in Cancer protein 1 (Hec1) is a constituent of the Ndc80 complex, a kinetochore component that has been shown to have a fundamental role in stable kinetochore-microtubule attachment, chromosome alignment and spindle checkpoint activation at mitosis. HEC1 RNA is found up-regulated in several cancer cells, suggesting a role for HEC1 deregulation in cancer. In light of this, we have investigated the consequences of experimentally-driven Hec1 expression on mitosis and chromosome segregation in an inducible expression system from human cells.

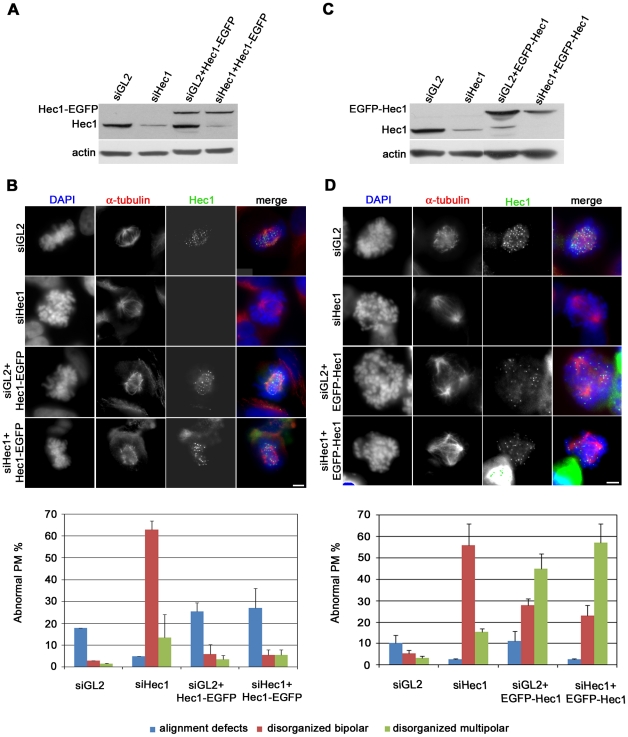
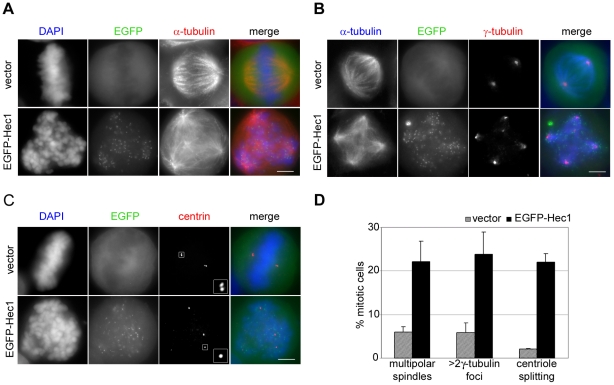
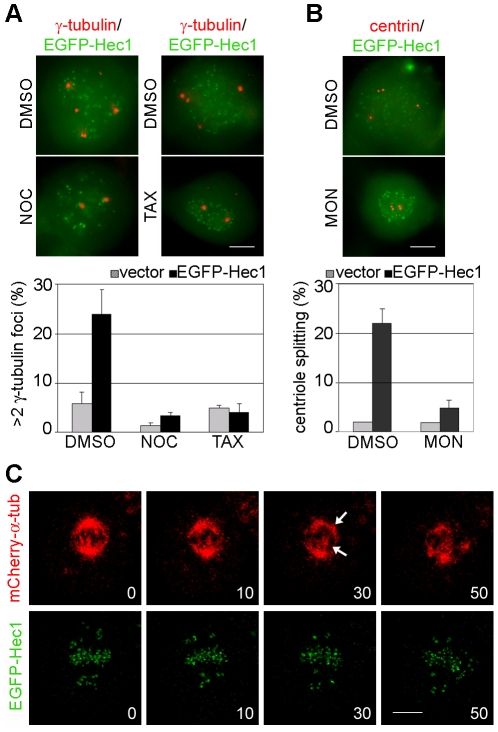
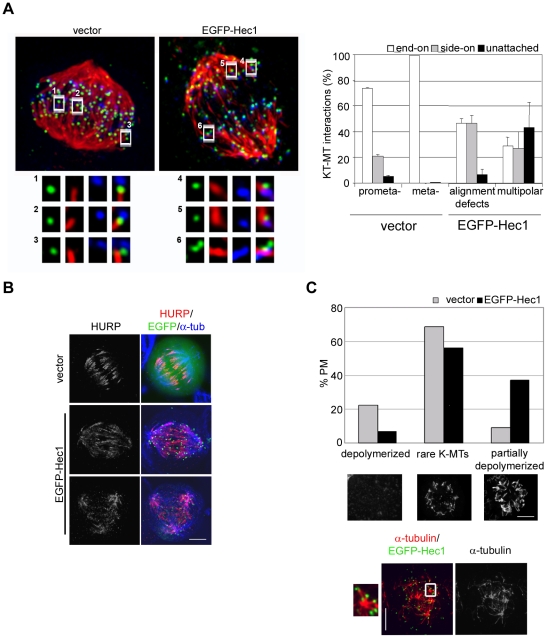
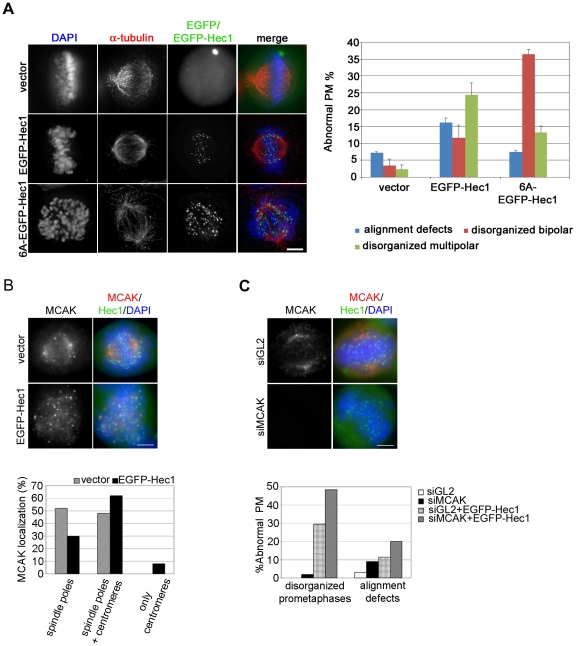
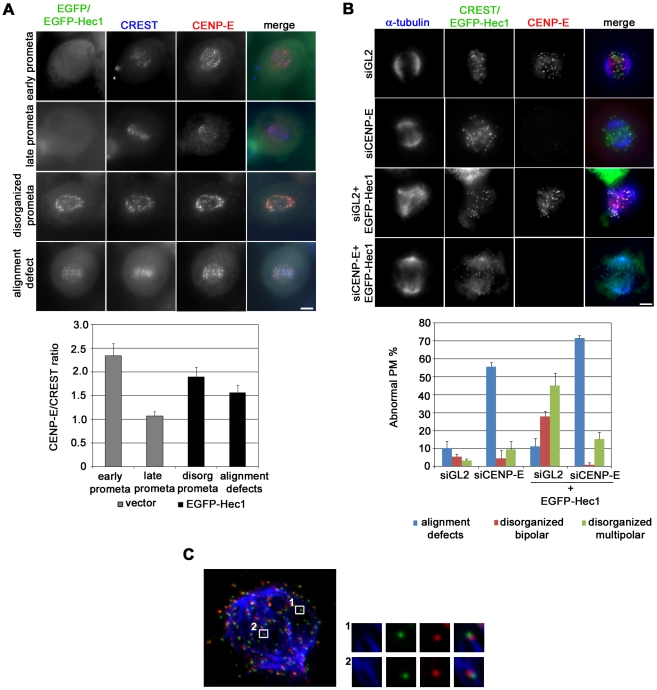
Methodology/principal findings: Overexpression of Hec1 could never be obtained in HeLa clones inducibly expressing C-terminally tagged Hec1 or untagged Hec1, suggesting that Hec1 cellular levels are tightly controlled. On the contrary, a chimeric protein with an EGFP tag fused to the Hec1 N-terminus accumulated in cells and disrupted mitotic division. EGFP- Hec1 cells underwent altered chromosome segregation within multipolar spindles that originated from centriole splitting. We found that EGFP-Hec1 assembled a mutant Ndc80 complex that was unable to rescue the mitotic phenotypes of Hec1 depletion. Kinetochores harboring EGFP-Hec1 formed persisting lateral microtubule-kinetochore interactions that recruited the plus-end depolymerase MCAK and the microtubule stabilizing protein HURP on K-fibers. In these conditions the plus-end kinesin CENP-E was preferentially retained at kinetochores. RNAi-mediated CENP-E depletion further demonstrated that CENP-E function was required for multipolar spindle formation in EGFP-Hec1 expressing cells.

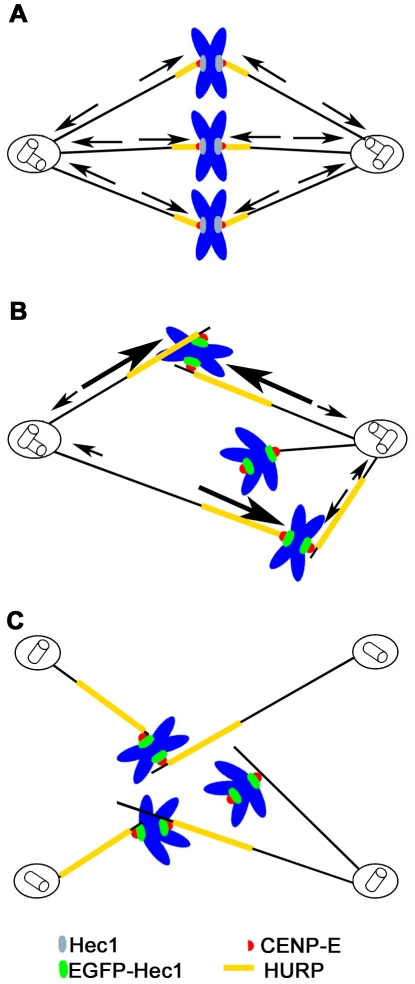
Conclusions/significance: Our study suggests that modifications on Hec1 N-terminal tail can alter kinetochore-microtubule attachment stability and influence Ndc80 complex function independently from the intracellular levels of the protein. N-terminally modified Hec1 promotes spindle pole fragmentation by CENP-E-mediated plus-end directed kinetochore pulling forces that disrupt the fine balance of kinetochore- and centrosome-associated forces regulating spindle bipolarity. Overall, our findings support a model in which centrosome integrity is influenced by the pathways regulating kinetochore-microtubule attachment stability.


Conflict of interest statement

Competing Interests: The authors have declared that no competing interests exist.

Figures

Figure 1
Figure 1. Inducible Hec1 expression in HeLa clones.
(A) Western blot analysis using an Hec1 antibody before (-) and after (+) doxycycline addition in HeLa clones expressing Hec1 (D clones), Hec1-EGFP (C clones) or EGFP-Hec1 (A clones). (B) Densitometric analysis of Hec1 expression in the different clones as measured by the ratio of total Hec1 (endogenous + exogenous) in induced (doxy) vs uninduced (cnt) conditions after normalization for vinculin expression. Data are mean ± SE of the ratios obtained in clones expressing untagged Hec1 (n = 10), Hec1-EGFP (n = 8) or EGFP-Hec1 (n = 8). (C) EGFP-Hec1 (green) localization after doxy induction in a prometaphase cell stained for CREST (blue) and tubulin (red). The boxed 2-fold enlargement shows EGFP-Hec1 localization with respect to the inner kinetochore marker CREST. Bar, 5 µm. (D) Chromosome congression and spindle organization before (-doxy) and after (+doxy) induction of Hec1-EGFP or EGFP-Hec1 expression as shown by α-tubulin (red) and DAPI (blue) staining. In uninduced samples Hec1 is visualized by antibody staining (green). Hec1-EGFP/-doxy: normal metaphase; Hec1-EGFP/+doxy: late prometaphase with unaligned chromosomes; EGFP-Hec1/-doxy: normal prometaphase; EGFP-Hec1/+doxy (fourth row): disorganized bipolar prometaphase; EGFP-Hec1/+doxy (last row): disorganized multipolar prometaphase. Bar, 5 µm. (E) Quantitative analysis of prometaphase abnormalities in Hec1-EGFP or EGFP-Hec1 expressing clones. Data are mean ± SE of 300 prometaphases (PM) for each condition in three independent experiments. Alignment defects were significantly higher in Hec1-EGFP expressing mitoses than in uninduced cells (P<0.01, t-test); disorganized bipolar prometaphases (P<0.05, t-test) and disorganized multipolar prometaphases (P<0.01, t-test) were significantly higher in EGFP-Hec1 expressing mitoses than in uninduced mitoses.
Figure 2
Figure 2. Expression of EGFP-Hec1 does not rescue the mitotic phenotypes induced by Hec1 depletion.
(A) Western blot analysis of Hec1 depletion with or without induced Hec1-EGFP expression. (B) Chromosome congression and spindle organization after α-tubulin (red) and DAPI staining (blue) in control (siGL2) or Hec1 silenced (siHec1) mitoses or mitoses expressing Hec1-EGFP after control silencing (siGL2+ Hec1-EGFP) or after Hec1 silencing (siHec1+ Hec1-EGFP). In siGL2 and siHec1 samples, Hec1 is visualized by antibody staining. The graph reports the frequencies of prometaphase abnormalities in the different conditions in Hec1-EGFP cells. Data are mean ± SE of 200 PM scored for each condition in two independent experiments. (C) Western blot analysis of Hec1 depletion with or without induced EGFP-Hec1 expression. (D) Chromosome congression and spindle organization after α-tubulin (red) and DAPI staining (blue) in control (GL2) or Hec1 silenced (siHec1) mitoses or mitoses expressing EGFP-Hec1 after control silencing (siGL2+ EGFP-Hec1) or after Hec1 silencing (siHec1+ EGFP-Hec1). In siGL2 and siHec1 samples, Hec1 is visualized by antibody staining. The graph reports the frequencies of prometaphase abnormalities in the different conditions in EGFP-Hec1 cells. Data are mean ± SE of 200-300 PM for each condition in two-four experiments. Disorganized bipolar prometaphases were significantly induced by siHec1 in both clones (P<0.01, t-test) and disorganized multipolar prometaphases were significantly induced after siHec1 in EGFP-Hec1 cells (P<0.05, t-test).
Figure 3
Figure 3. EGFP-Hec1 expression induces multipolar spindles and centrosomal abnormalities.
(A) Vector or EGFP-Hec1 (green) transfected cells stained for α-tubulin (red) and DAPI (blue). The EGFP-Hec1 disorganized prometaphase exhibited a multipolar spindle. (B) Vector or EGFP-Hec1 (green) transfected cells stained with antibodies to α-tubulin (blue) and γ-tubulin (red). 5 γ-tubulin spots connected to spindle microtubules were present in the EGFP-Hec1 cell. (C) Vector or EGFP-Hec1 (green) transfected cells stained with antibodies to centrin (red). The boxed 3-fold enlargements show a centriole pair in the vector-transfected metaphase and one single centriole in the EGFP-Hec1 disorganized prometaphase. (D) Mean percentage (± SE) of multipolar spindles detected by α-tubulin staining (n = 300 from triplicate assays), >2 γ-tubulin foci (n>200 from triplicate assays) and centriole splitting (n = 200 from duplicate assays) in vector and EGFP-Hec1 transfected mitoses. Multipolar spindles (α-and γ-tubulin staining, P<0.05, t-test) and splitted centrioles (P<0.01, t-test) were significantly higher in EGFP-Hec1 expressing mitoses than in vector cells. Bars, 5 µm.
Figure 4
Figure 4. Spindle pole fragmentation is due to an unbalance of forces within the mitotic spindle.
(A) Merged image of EGFP-Hec1 (green) expressing prometaphases stained for γ-tubulin (red) after incubation with nocodazole (NOC), taxol (TAX) or DMSO for the last 4 h expression time. Only 2 γ-tubulin signals are present after NOC or TAX treatment in the EGFP-Hec1 cells. The graph shows the mean percentage (± SE) of mitotic cells with >2 γ-tubulin foci in vector or EGFP-Hec1 cells treated with NOC, TAX or DMSO (n = 200 from duplicate assays). (B) Merged image of EGFP-Hec1 (green) expressing prometaphases stained for centrin (red) after incubation with monastrol (MON) or DMSO for the last 4 h expression time. The graph shows the mean percentage (± SE) of mitotic cells with splitted centrioles in vector or EGFP-Hec1 cells treated with MON or DMSO (n = 200 from duplicated assays). (C) HeLa cells cotransfected with EGFP-Hec1 (green) and mCherry-α-tubulin (red) vectors were recorded by time-lapse microscopy during mitosis. mCherry- α-tubulin shows that the late prometaphase showing many unaligned KTs initially possessed a bipolar spindle (0). KTs attempted to congress within the bipolar spindle (10), but, then, two supernumerary spindle poles appeared under mCherry-tubulin fluorescence (30, arrows). Spindle poles successively moved apart and the KTs re-organized within the multipolar spindle (50). Time is given in min. Bars, 5 µm.
Figure 5
Figure 5. Erroneous kinetochore-microtubule attachments in EGFP-Hec1 cells stabilize K-fibers.
(A) KT-MT attachments in a late prometaphase (vector) and an EGFP-Hec1 expressing disorganized bipolar prometaphase (EGFP-Hec1) exposed to MG132 for 2 h and stained for CREST (blue) and α-tubulin (red) after calcium buffer treatment. Kinetochores (green) are visualized by anti-Hec1 antibody (vector) or EGFP-Hec1 (EGFP-Hec1). Maximum projections from deconvolved z-stacks are shown. Insets show a 3-fold enlargement of 2-3 slices from the boxed regions. In the vector prometaphase two end-on attachments (1,2) and one side-on attachment close to the MT end (3) are shown. In the EGFP-Hec1 cell two side-on attachments similar to the one observed in the vector cell (4,5) and one side-on attachment along a continuing MT (6) are reported. Bar 5 µm. The graph reports a quantitative analysis of the different types of attachments on 175–284 kinetochores in 2–3 cells for each mitotic stage. Alignment defects include disorganized bipolar prometaphases. (B) HURP (red) and α-tubulin (blue) staining in vector or EGFP-Hec1 cells. HURP localization extended towards the MT minus-ends in the EGFP-Hec1 cell. (C) Quantitative analysis of MT depolymerization in NOC-treated vector and EGFP-Hec1 prometaphases (PM) (n = 200). Representative examples of the different classes of MT depolymerization are presented below the graph (α-tubulin staining). Localization of residual MTs (α-tubulin, red) with respect to KTs (EGFP-Hec1, green) in a EGFP-Hec1 expressing prometaphase after NOC treatment. Inset shows a 3-fold enlargement of the boxed region in the merge.
Figure 6
Figure 6. EGFP-Hec1 misattachments allow a partial MT dynamics at kinetochore.
(A) EGFP, EGFP-Hec1 or 6A-EGFP-Hec1 (green) expressing cells stained for α-tubulin (red) and DAPI (blue). The vast majority of chromosomes were unaligned in the 6A-EGFP-Hec1 prometaphase. The graph shows a quantitative analysis of prometaphase abnormalities in EGFP (vector), EGFP-Hec1 or 6A-EGFP-Hec1 expressing cells. (B) EGFP and EGFP-Hec1 cells were stained with antibodies to MCAK (red) and Hec1 (only for vector, green), DNA in blue. MCAK accumulated on several centromeres in the EGFP-Hec1 prometaphase. The graph shows a quantitative analysis of MACK localization in mitotic cells (n = 50). (C) MCAK (red) staining after control (GL2)- or MCAK-siRNA transfection in EGFP-Hec1 (green) cells. MCAK was efficiently depleted in the EGFP-Hec1 cell. The graph shows the percentage of abnormal phenotypes in GL2- or MCAK-silenced prometaphase/metaphase (PM/M) cells (n≥100) with or without EGFP-Hec1 expression, as scored by MCAK and DAPI staining; Both alignment defects (P<0.05, χ2 test) and disorganized prometaphases (P<0.01, χ2 test) were higher in MCAK-siRNA/EGFP-Hec1 than in GL2-siRNA/EGFP-Hec1 cells. Bars, 5 µm.
Figure 7
Figure 7. CENP-E function is implicated in centrosomal fragmentation.
(A) Kinetochore accumulation of CENP-E (red) in an early and a late normal prometaphase from vector transfected cultures and in a disorganized prometaphase and a late prometaphase with alignment defects from EGFP-Hec1 (green) trasfected cultures. Kinetochores are marked by CREST staining (blue). The graph shows a quantitative analysis of CENP-E intensity at kinetochores, in vector and EGFP-Hec1 transfected cells. CENP-E/CREST ratio was significantly higher in disorganized prometaphases (P<0.01, t-test) and in prometaphases with alignment defects (P<0.05) from EGFP-Hec1 expressing cells than in normal late prometaphases from vector transfected cells. (B) Chromosome congression and spindle organization in control (siGL2) or CENP-E silenced (siCENP-E) mitoses or mitoses expressing EGFP-Hec1 after control silencing (siGL2+ EGFP-Hec1) or CENP-E silencing (siCENP-E + EGFP-Hec1). Mitoses were observed after α-tubulin (blue) and CENP-E (red) staining. Kinetochores were identified by CREST staining in siGL2 and siCENP-E samples or by EGFP expression in induced samples (green). The graph shows the frequencies of abnormal PM in the different conditions. Data are mean ± SE of >150 PM scored for each condition in two experiments. Bars, 5 µm. (C) KT-MT attachments in an EGFP-Hec1 (green) expressing disorganized bipolar prometaphase exposed to MG132 for 2 h and stained for CENP-E (red) and α-tubulin (blue) after calcium buffer treatment. A maximum projection from deconvolved z-stacks is shown. Insets show a 3-fold enlargement of one optical slice from the boxed regions. An end-on attachment (inset 1) and a side-on attachment (inset 2) are shown.
Figure 8
Figure 8. Schematic representation of the mechanism producing centrosome fragmentation after EGFP-Hec1 expression.
(A) Metaphase cell with balanced spindle forces (arrows). (B) EGFP-Hec1 expressing prometaphase cell. EGFP-Hec1 kinetochores (green) form lateral kinetochore-microtubule attachments that recruit more CENP-E (red) and HURP (yellow). CENP-E mediated plus-end directed forces (large arrows) overcomes the dynein-mediated minus-end forces (small arrows). (C) Kinetochore directed CENP-E mediated forces produce centrosome fragmentation and centriole splitting.

Similar articles

Cited by

References

    1. Cheeseman IM, Desai A. Molecular architecture of the kinetochore-microtubule interface. Nat Rev Mol Cell Biol. 2008;9:33–46. - PubMed
    1. Santaguida S, Musacchio A. The life and miracles of kinetochores. EMBO J. 2009;28:2511–2531. - PMC - PubMed
    1. Musacchio A, Salmon ED. The spindle-assembly checkpoint in space and time. Nat Rev Mol Cell Biol. 2007;8:379–393. - PubMed
    1. Kops GJ, Weaver BA, Cleveland DW. On the road to cancer: aneuploidy and the mitotic checkpoint. Nat Rev Cancer. 2005;5:773–785. - PubMed
    1. Cimini D, Degrassi F. Aneuploidy: a matter of bad connections. Trends Cell Biol. 2005;15:442–451. - PubMed

Publication types