. 2011 Jan 28;6(1):e16411.
doi: 10.1371/journal.pone.0016411.

MCT expression and lactate influx/efflux in tanycytes involved in glia-neuron metabolic interaction

Affiliations

MCT expression and lactate influx/efflux in tanycytes involved in glia-neuron metabolic interaction

Christian Cortés-Campos et al. PLoS One. .

Abstract

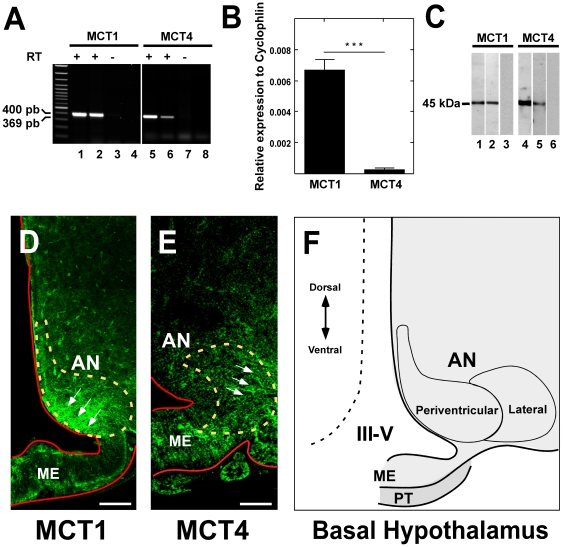
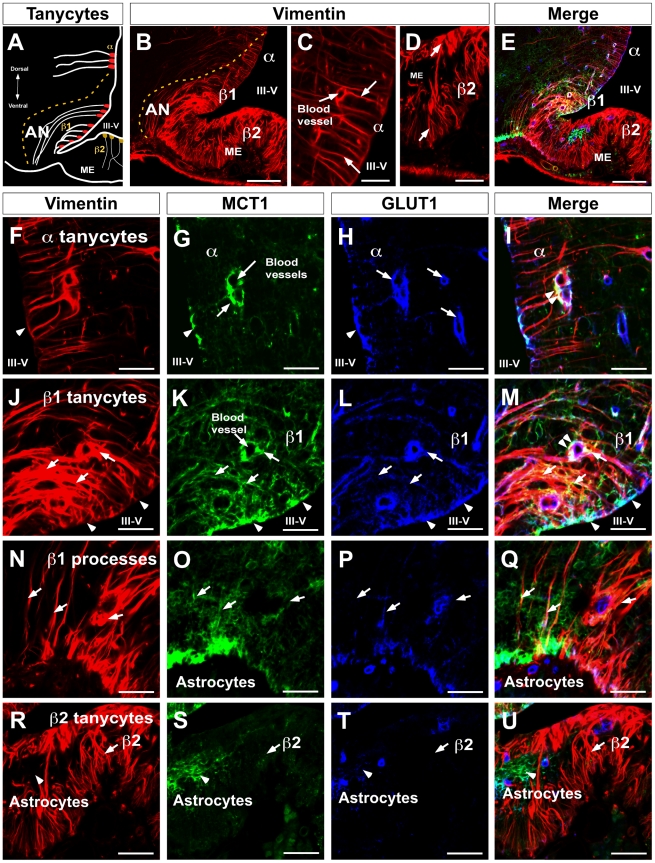
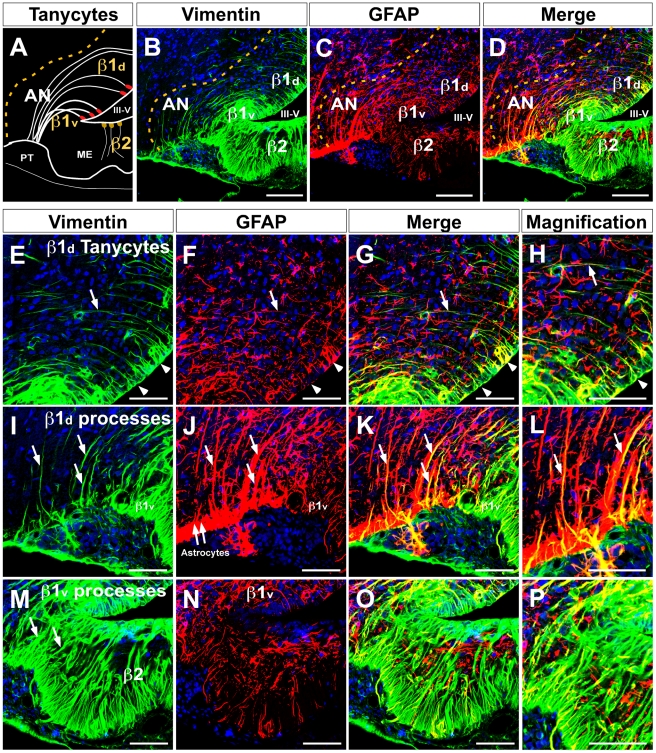
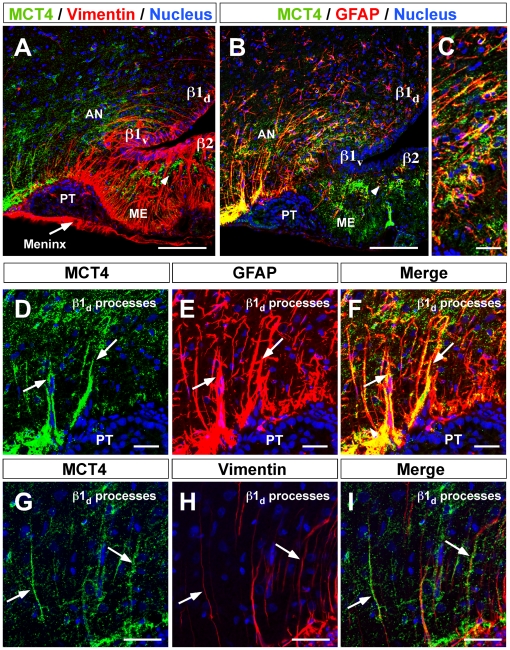
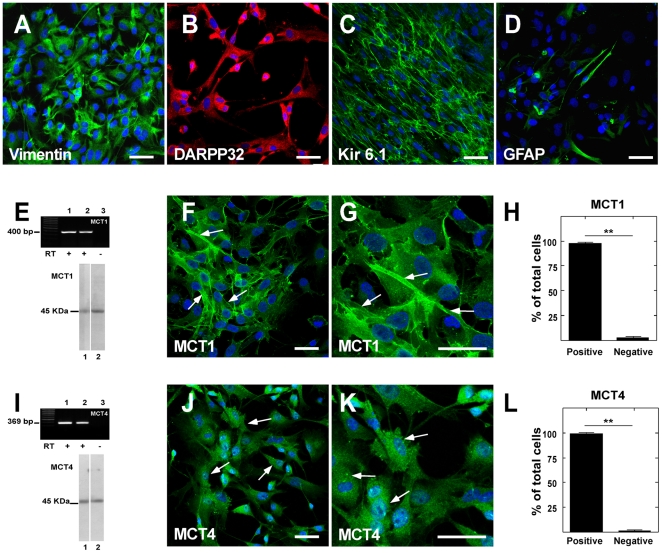
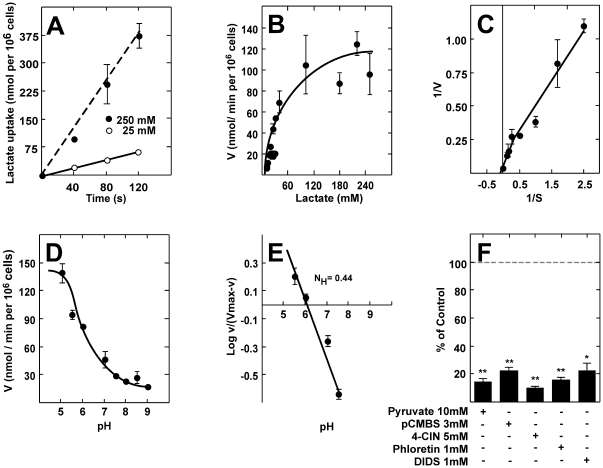
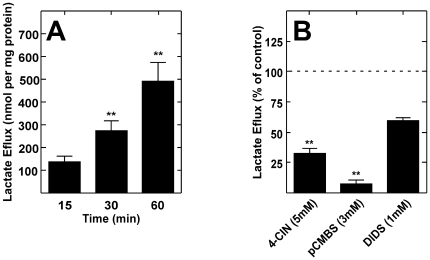
Metabolic interaction via lactate between glial cells and neurons has been proposed as one of the mechanisms involved in hypothalamic glucosensing. We have postulated that hypothalamic glial cells, also known as tanycytes, produce lactate by glycolytic metabolism of glucose. Transfer of lactate to neighboring neurons stimulates ATP synthesis and thus contributes to their activation. Because destruction of third ventricle (III-V) tanycytes is sufficient to alter blood glucose levels and food intake in rats, it is hypothesized that tanycytes are involved in the hypothalamic glucose sensing mechanism. Here, we demonstrate the presence and function of monocarboxylate transporters (MCTs) in tanycytes. Specifically, MCT1 and MCT4 expression as well as their distribution were analyzed in Sprague Dawley rat brain, and we demonstrate that both transporters are expressed in tanycytes. Using primary tanycyte cultures, kinetic analyses and sensitivity to inhibitors were undertaken to confirm that MCT1 and MCT4 were functional for lactate influx. Additionally, physiological concentrations of glucose induced lactate efflux in cultured tanycytes, which was inhibited by classical MCT inhibitors. Because the expression of both MCT1 and MCT4 has been linked to lactate efflux, we propose that tanycytes participate in glucose sensing based on a metabolic interaction with neurons of the arcuate nucleus, which are stimulated by lactate released from MCT1 and MCT4-expressing tanycytes.


Conflict of interest statement

Competing Interests: The authors have declared that no competing interests exist.

Figures

Figure 1
Figure 1. MCT1 and MCT4 expression and localization in adult rat hypothalamus.
A, RT-PCR analysis of MCT1 and MCT4. MCT1 RT-PCR products obtained using total RNA isolated from: Lane 1, kidney cortex; 2, hypothalamus; 3 RT(-) of hypothalamus; 4, water in the PCR reaction. MCT4 RT-PCR products obtained using total RNA isolated from: Lane 5, skeletal muscle; 6, hypothalamus; 7 RT(-) of hypothalamus; 8, water in the PCR reaction. B, Quantitative RT-PCR analysis of the MCT1 and MCT4 mRNA levels in samples isolated from rat hypothalamus. **p<0.001. Data represent the means ± SD of the ratio of MCT mRNA to cyclophilin mRNA from three independent experiments. C, Western blot analysis of MCT1 and MCT4. Lanes 1–3, MCT1; 4–6, MCT4. Total protein extracts were prepared from renal cortex (lane 1), hypothalamus (lanes 2 and 5), negative control (lanes 3 and 6), and skeletal muscle (lane 4). Negative controls were performed in hypothalamus with primary antibodies preabsorbed with inductor peptides (lanes 4 and 6). D, Immunohistochemistry of MCT1 and confocal microscopy analysis. MCT1 is observed in the arcuate nucleus periventricular region (arrows). E, Immunohistochemistry of MCT4 and confocal microscopy analysis. MCT4 is localized in the arcuate nucleus lateral area (arrows). F, Schematic representation of basal hypothalamus. AN, arcuate nucleus; III-V, third ventricle; ME, median eminence; PT, pars tuberalis. Scale bar D–E, 200 µm.
Figure 2
Figure 2. MCT1 and GLUT1 codistribution in β1-tanycytes.
A, Schematic representation of hypothalamic area showed in B and E. B, rat frontal brain section using anti-vimentin antibodies. C, High magnification of α1-tanycytes using anti-vimentin antibodies. D, High magnification of β2-tanycytes using anti-vimentin antibodies. E, rat frontal brain section using anti-vimentin (red), anti-GLUT1 (blue), and anti-MCT1 (green) antibodies. F–I, α1-tanycyte area, MCT1 and GLUT1 were observed in the ventricular cellular membranes and end-feet processes contacting blood vessels. J–M, β1-tanycyte area, MCT1 was expressed in the proximal area of the cells colocalizing with GLUT1 and vimentin (head arrows). β1-tanycyte processes contacting periventricular AN neurons were strongly positive for MCT1 (arrows); colocalization with GLUT1 was also observed in blood vessels (arrows). N–Q, β1-tanycyte processes contacting the external region of the brain showed lower reaction for MCT1 and GLUT1. R–U, β2-tanycytes and processes in the median eminence showed negative immunoreaction for MCT1 and GLUT1. AN, arcuate nucleus, III-V: third ventricle, ME: median eminence. Scale bar: B and E, 150 µm; C–D, and F–U, 50 µm.
Figure 3
Figure 3. Dorsal and ventral β1-tanycytes distribution in the basal hypothalamus.
A, Schematic representation of the hypothalamic basal area showing dorsal and ventral β1-tanycytes. B, Low magnification of the basal hypothalamic area using anti-vimentin antibodies (green) and the TOPRO nuclear stain (blue). C, Low magnification using anti-GFAP antibodies (red) and the TOPRO nuclear stain (blue). D, Differential distribution of vimentin and GFAP in dorsal and ventral β1-tanycytes. E–L, Dorsal β1-tanycytes (β1d) showed reduced vimentin staining. The reaction was concentrated in the ventricular area (E, head arrows), which was also positive for GFAP (F–H). The processes of these cells were strongly positive for GFAP (J–L, arrows). M–P, Ventral β1-tanycytes (β1v) showed intense immunoreaction for vimentin (M) and very low staining with anti-GFAP (N–P). AN, arcuate nucleus, III-V: third ventricle, ME: median eminence. Scale bar: B–D, 150 µm; E–G, I–K and M–O, 50 µm; H, L and P, 25 µm.
Figure 4
Figure 4. MCT4 localization in dorsal β1-tanycytes.
A, Low magnification of hypothalamic area using anti-MCT4 antibodies (green), anti-vimentin antibodies (red), and the nuclear stain, TOPRO (blue). B, Low magnification using anti-MCT4 antibodies (green), anti-GFAP antibodies (red), and the TOPRO nuclear stain (blue). C, High magnification showing GFAP-positive processes of β1d-tanycytes in contact with lateral AN neurons. β1d-tanycytes processes were positive for MCT4 and GFAP (D–F). MCT4 was expressed in a number of β1-tanycyte processes, which expressed vimentin (G–I, arrows). AN, arcuate nucleus, III-V: third ventricle, ME: median eminence. Scale bar: A–B, 150 µm; C–I, 50 µM; J–L, 25 µm.
Figure 5
Figure 5. MCT1 and MCT4 expression in tanycyte cultures.
A–D, Tanycyte cultures showed high expression of vimentin, DARPP-32, and Kir 6.1 and a small number of GFAP-positive cells. E, MCT1 RT-PCR (upper panel) and immunoblot (lower panel) analyses. RNA isolated from renal cortex (lane 1) and tanycyte cultures (lane 2). RT(-) of tanycyte culture (lane 3). Total protein extracted from renal cortex (lane 1) and tanycyte cultures (lane 2). F–G, Immunohistochemical studies using anti-MCT1 antibodies (green) and TOPRO nuclear stain (blue). H, Average MCT1-positive cells. I, MCT4 RT-PCR (upper panel) and immunoblot (lower panel) analyses. RNA isolated from skeletal muscle (lane 1) and tanycyte cultures (lane 2). Total protein extracted from skeletal muscle (lane 1) and tanycyte cultures (lane 2). J–K, MCT4 immunohistochemical studies using anti-MCT4 antibodies (green) and TOPRO nuclear stain (blue). L, Average of MCT4-positive cells. Scale bar: 25 µm.
Figure 6
Figure 6. Functional characterization of cultured tanycytes.
A, 25 mM L-lactate (open circles) and 250 mM L-lactate (closed circles) transport at 4°C and pH 7.0 over time. B, Kinetic parameters of L-lactate transport in tanycyte cultures at 1 min, 4°C, and pH 7.0. C, Double-reciprocal plot of MCT1: (Km, 6 mM; Vmax, 13 nmol×106 cells/min) and MCT4: (Km, 48 mM; Vmax, 100 nmol×106 cells/min). D, Dependence of lactate uptake on pH (0.1 mM L-lactate, 4°C). E, Hill plot to analyze the dependence of lactate uptake on pH. F, Analysis of lactate transport in the presence of various inhibitors co-incubated for 1 min (0.1 mM lactate, 4°C, pH 7.0). Results represent the mean ± SD of three independent experiments. **p<0.001, one tailed t-test.
Figure 7
Figure 7. Cultured tanycytes release lactate.
A, Lactate efflux at 5 mM glucose. Lactate efflux increased throughout the incubation time. B, Analysis of lactate efflux in the presence of several inhibitors pre-incubated for 15 min at 37°C. Lactate efflux decreased significantly with 4-CIN and pCMBS. **p<0.001, one tailed t-test. Results represent the average ± SD of three independent experiments.

References

    1. Levin BE, Routh VH, Kang L, Sanders NM, Dunn-Meynell AA. Neuronal glucosensing: what do we know after 50 years? Diabetes. 2004;53:2521–2528. - PubMed
    1. Levin BE, Dunn-Meynell AA, Routh VH. Brain glucose sensing and body energy homeostasis: role in obesity and diabetes. Am J Physiol. 1999;276:R1223–1231. - PubMed
    1. Oomura Y, Ono T, Ooyama H, Wayner MJ. Glucose and osmosensitive neurones of the rat hypothalamus. Nature. 1969;222:282–284. - PubMed
    1. Song Z, Routh VH. Differential effects of glucose and lactate on glucosensing neurons in the ventromedial hypothalamic nucleus. Diabetes. 2005;54:15–22. - PubMed
    1. Wang R, Liu X, Hentges ST, Dunn-Meynell AA, Levin BE, et al. The regulation of glucose-excited neurons in the hypothalamic arcuate nucleus by glucose and feeding-relevant peptides. Diabetes. 2004;53:1959–1965. - PubMed

Publication types