Comparative Study
. 2011 Jan 28;6(1):e16464.
doi: 10.1371/journal.pone.0016464.

Differential in vitro effects of intravenous versus oral formulations of silibinin on the HCV life cycle and inflammation

Affiliations
Comparative Study

Differential in vitro effects of intravenous versus oral formulations of silibinin on the HCV life cycle and inflammation

Jessica Wagoner et al. PLoS One. .

Abstract

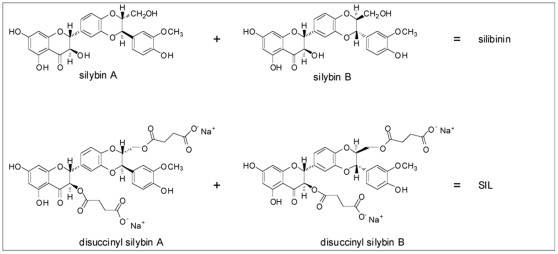
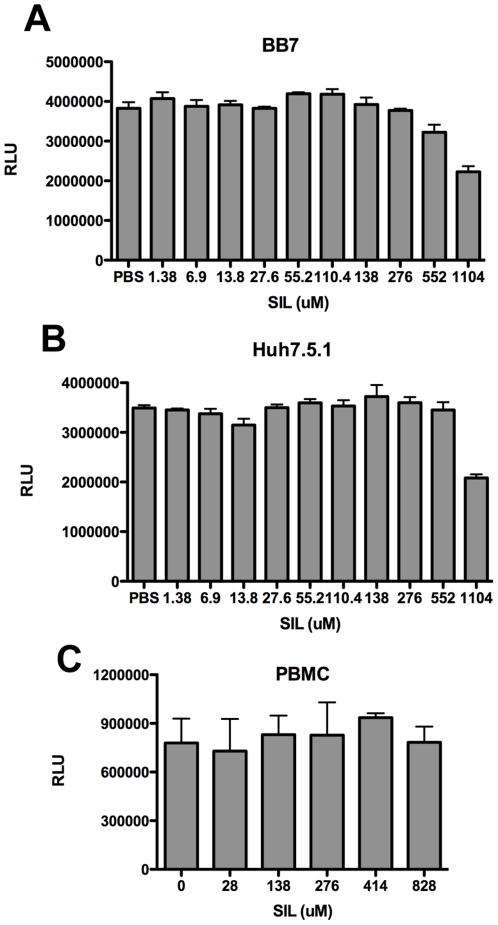
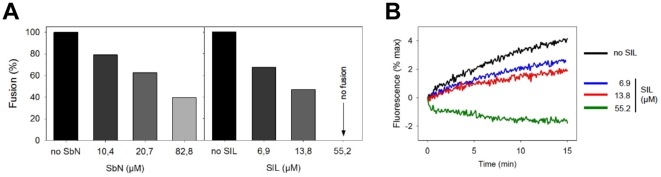
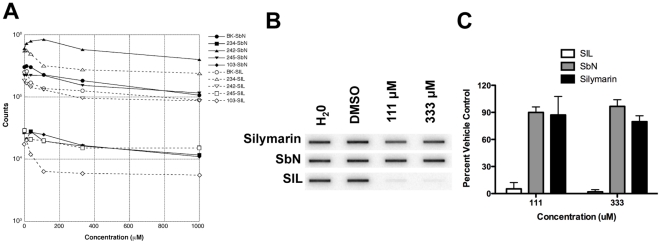
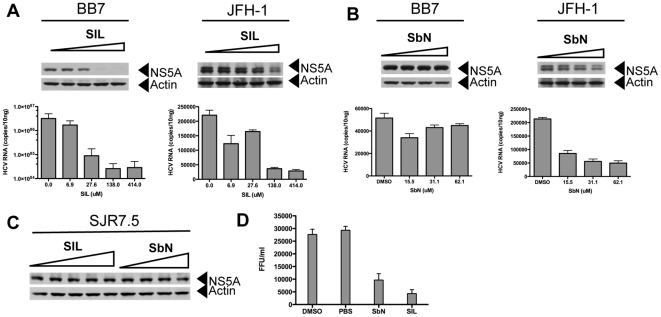
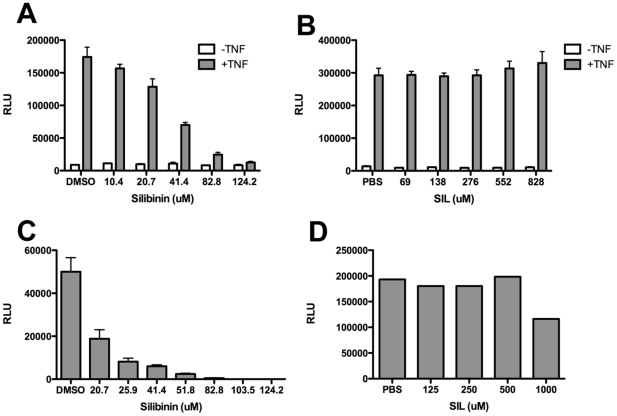
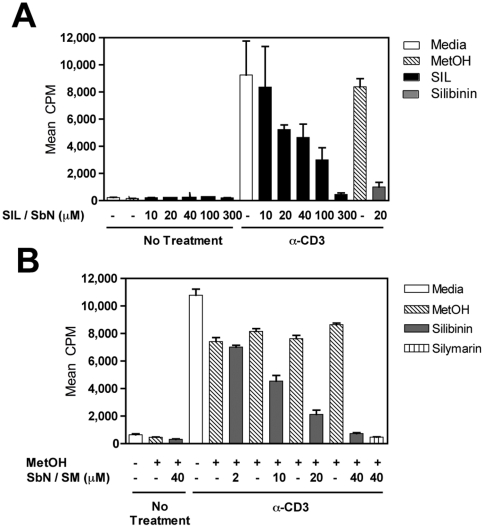
Silymarin prevents liver disease in many experimental rodent models, and is the most popular botanical medicine consumed by patients with hepatitis C. Silibinin is a major component of silymarin, consisting of the flavonolignans silybin A and silybin B, which are insoluble in aqueous solution. A chemically modified and soluble version of silibinin, SIL, has been shown to potently reduce hepatitis C virus (HCV) RNA levels in vivo when administered intravenously. Silymarin and silibinin inhibit HCV infection in cell culture by targeting multiple steps in the virus lifecycle. We tested the hepatoprotective profiles of SIL and silibinin in assays that measure antiviral and anti-inflammatory functions. Both mixtures inhibited fusion of HCV pseudoparticles (HCVpp) with fluorescent liposomes in a dose-dependent fashion. SIL inhibited 5 clinical genotype 1b isolates of NS5B RNA dependent RNA polymerase (RdRp) activity better than silibinin, with IC50 values of 40-85 µM. The enhanced activity of SIL may have been in part due to inhibition of NS5B binding to RNA templates. However, inhibition of the RdRps by both mixtures plateaued at 43-73%, suggesting that the products are poor overall inhibitors of RdRp. Silibinin did not inhibit HCV replication in subgenomic genotype 1b or 2a replicon cell lines, but it did inhibit JFH-1 infection. In contrast, SIL inhibited 1b but not 2a subgenomic replicons and also inhibited JFH-1 infection. Both mixtures inhibited production of progeny virus particles. Silibinin but not SIL inhibited NF-κB- and IFN-B-dependent transcription in Huh7 cells. However, both mixtures inhibited T cell proliferation to similar degrees. These data underscore the differences and similarities between the intravenous and oral formulations of silibinin, which could influence the clinical effects of this mixture on patients with chronic liver diseases.


Conflict of interest statement

Competing Interests: The authors have declared that no competing interests exist.

Figures

Figure 1
Figure 1. Chemical structures of SIL and silibinin.
See text for details.
Figure 2
Figure 2. Cytotoxicity profile of SIL on BB7 subgenomic replicon cells (A), Huh7.5.1 cells (B), and PBMC (C).
Cells were plated in quadruplicate in 96 well plates and the indicated concentrations of SIL in PBS were added. Cells were incubated for 72 hours (for BB7 and Huh7.5.1 cells) and 24 hours for PBMCs before ATP levels were measured as described in the Materials and Methods. Fluorescence is reported as relative light units (RLU).
Figure 3
Figure 3. Silibinin and SIL inhibit HCVpp-mediated fusion.
Membrane fusion between HCVpp and R18-labeled liposomes was followed by fluorescence spectroscopy with excitation and emission at 560 and 590 nm, respectively. Fluorescent liposomes (12.5 µM final lipid concentration) were added to 20 µl of HCVpp in PBS pH 7.4 at 37°C, in the absence or presence of 5, 10 or 40 µg/ml of indicated compound, which corresponds to 6.9, 13.8 or 55 µM of SIL and 10.4, 20.7, and 82.8 µM of silibinin. After a 2 min-equilibration, lipid mixing was initiated by decreasing the pH to 5.0 with diluted HCl, and R18 dequenching was recorded. Maximal fluorescence was obtained after addition of 0.1% final Triton X-100 to the cuvette. A, values of the last min of fusion (final extent of fusion) were used to calculate the percentage of fusion in the presence of the drug, relative to 100% fusion in the absence of drug. Results are expressed from the mean of 2 separate experiments. Compounds were added at 5 (black), 10 (dark grey) or 40 µg/ml (light grey). B, fusion kinetics of HCVpp with liposomes, in the absence (black) or presence of three concentrations of SIL: blue, 5 µg/ml; red, 10 µg/ml and green, 40 µg/ml.
Figure 4
Figure 4. Effect of silibinin and SIL on HCV RdRp Activity and Binding to RNA.
A, Effects of silibinin and SIL on RNA synthesis by the HCV RdRp. Purified HCV subtype 1b RdRps from the reference isolate BK and 4 patient derived-isolates were preincubated with poly-C and G10, then [α 32P]GTP and varying concentrations of silibinin or SIL were added and the reactions were incubated to permit RNA synthesis. The 32P-labeled RNA was collected on nitrocellulose filters and retained radioactivity was measured by scintillation counting. Solid black lines, filled symbols, and SbN indicate silibinin-containing reactions; open symbols, dashed lines, and SIL indicate SIL containing reactions. Concentrations are in micromolar. B, Example RNA binding assay measuring the effect of silymarin, SbN, and SIL on RNA binding by the HCV RNA polymerase. Purified RNA polymerase from the reference strain BK was allowed to bind to a 32P-labeled RNA in the presence of varying concentrations of the drugs, the mixture was passed through a nitrocellulose filter to collect protein:RNA complexes, the filter was washed, and retained RNA was detected by phosphorimage analysis. C, Summary of 4 independent repeats of the RNA binding assays. All data are normalized to values obtained with the DMSO vehicle control, and error bars represent the standard deviation of the measurements.
Figure 5
Figure 5. Antiviral Activity of SIL and silibinin.
A, effect of SIL on HCV replication in genotype 1b subgenomic replicon cells (BB7) and JFH-1 infection of Huh7.5.1 cells. The top panels show HCV NS5A protein expression detected by western blot, while the lower graph depicts HCV RNA levels determined by real time RT-PCR. Cells were treated with 0, 6.9, 27.6, 138, and 414 µM of SIL for 72 hours before protein and RNA isolations. B, effect of silibinin on HCV replication in genotype 1b subgenomic replicon cells (BB7) and JFH-1 infection of Huh7.5.1 cells. Cells were treated with DMSO, 15.5, 31.1, and 62.1 µM of silibinin for 72 hours before protein and RNA isolations. C, effects of SIL and silibinin on HCV replication in subgenomic JFH-1 replicon cells. Cells were treated with 0, 6.9, 27.6, 138, and 414 µM of SIL or DMSO, 20.7, 41.4, and 82.8 µM of silibinin for 72 hours before proteins were extracted and NS5A detected by western blot. D, effect of SIL and silibinin on progeny virus production. Huh7.5.1 cells were treated with 20 µg/ml silibinin, 300 µg/ml SIL or DMSO and PBS controls immediately after 5 hours of adsorption with JFH-1 at an m.o.i. of 0.05. Culture supernatants were harvested 72 hours later and carry over silibinin or SIL was removed by concentration through 10,000 molecular filters. Supernatants were diluted 1∶100 in Huh7 media and used to infect naïve Huh7.5.1 cells in triplicate and immunofluorescent detection of HCV core protein was performed. Foci were counted manually and used to calculate infectious virus yields expressed as focus forming units per milliliter (FFU/ml). Error bars represent standard deviations of triplicate cultures.
Figure 6
Figure 6. Silibinin but not SIL inhibits innate inflammatory and antiviral signaling.
A, B, effect of silibinin and SIL on NF-κB dependent transcription. Huh7 cells were transfected with an NF-κB responsive reporter plasmid (pRDII-luc) and twenty-four hours later, cells were pretreated with the indicated doses of silibinin (A) or SIL (B). Cells were then treated with 10 ng/ml TNF-α and luciferase activity measured by Britelite assay 3.5 hours later. C, D, effect of silibinin and SIL on IRF-3 driven transcription from the IFN-B promoter. Huh7.5.1 cells were co-transfected with a luciferase reporter plasmid under control of the IFN-B promoter and IRF-35D, a constitutively active mutant of IRF-3 . Twenty-four hours later, cells were pretreated with the indicated doses of silibinin (C) or SIL (D). Luciferase activity measured by Britelite assay 24 hours later. Fluorescence is reported as relative light units (RLU). Error bars represent standard deviation from triplicate cultures.
Figure 7
Figure 7. SIL and silibinin dose-dependently inhibit T cell proliferation.
For all assays, a single dose of silibinin or SIL was added at culture initiation and compared to parallel cultures treated with a single dose of silibinin vehicle (MetOH) or media (control for SIL). Freshly isolated PBMC were tested for proliferative responses to plate-bound anti-CD3 (10 µg/mL) stimulation measured using 3H-thymidine incorporation. A, PBMC cultures treated with SIL at various doses (black bars) and the media control (white bar). Cells were also separately treated with silibinin control (gray bar), and the corresponding methanol control (hatched bar). B, PBMC cultures were treated with silibinin at various doses (gray bars), or with methanol solvent controls (hatched bars). Cells were also treated with silymarin as a positive control for inhibition of proliferation (bar with vertical lines). Open bars represent proliferation of PBMC stimulated with anti-CD3 alone in media, which serves as the control for SIL treatment. Results are shown as mean cpm incorporated. Error bars indicate 1 standard deviation among 3–4 replicates for each condition.

References

    1. Perz JF, Armstrong GL, Farrington LA, Hutin YJ, Bell BP. The contributions of hepatitis B virus and hepatitis C virus infections to cirrhosis and primary liver cancer worldwide. J Hepatol. 2006;45:529–538. - PubMed
    1. Fried MW, Shiffman M, Sterling RK, Weinstein J, Crippin J, et al. A multicenter, randomized trial of daily high-dose interferon-alfa 2b for the treatment of chronic hepatitis c: pretreatment stratification by viral burden and genotype. Am J Gastroenterol. 2000;95:3225–3229. - PubMed
    1. Fried MW, Shiffman ML, Reddy KR, Smith C, Marinos G, et al. Peginterferon alfa-2a plus ribavirin for chronic hepatitis C virus infection. N Engl J Med. 2002;347:975–982. - PubMed
    1. Manns MP, McHutchison JG, Gordon SC, Rustgi VK, Shiffman M, et al. Peginterferon alfa-2b plus ribavirin compared with interferon alfa-2b plus ribavirin for initial treatment of chronic hepatitis C: a randomised trial. Lancet. 2001;358:958–965. - PubMed
    1. Kroll DJ, Shaw HS, Oberlies NH. Milk thistle nomenclature: why it matters in cancer research and pharmacokinetic studies. Integr Cancer Ther. 2007;6:110–119. - PubMed

Publication types