

Single-beat noninvasive imaging of ventricular endocardial and epicardial activation in patients undergoing CRT
- PMID: 21298045
- PMCID: PMC3029283
- DOI: 10.1371/journal.pone.0016255
Single-beat noninvasive imaging of ventricular endocardial and epicardial activation in patients undergoing CRT
Abstract
Background: Little is known about the effect of cardiac resynchronization therapy (CRT) on endo- and epicardial ventricular activation. Noninvasive imaging of cardiac electrophysiology (NICE) is a novel imaging tool for visualization of both epi- and endocardial ventricular electrical activation.
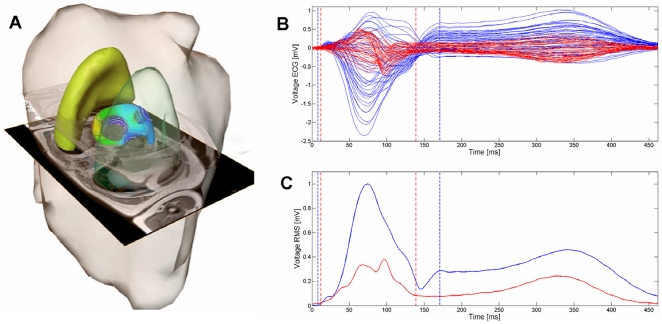
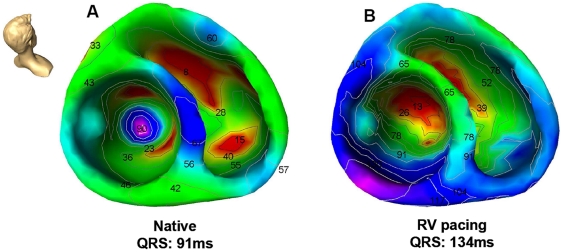
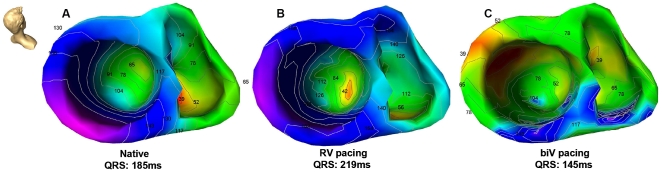
Methodology/principal findings: NICE was performed in ten patients with congestive heart failure (CHF) undergoing CRT and in ten patients without structural heart disease (control group). NICE is a fusion of data from high-resolution ECG mapping with a model of the patient's individual cardiothoracic anatomy created from magnetic resonance imaging. Beat-to-beat endocardial and epicardial ventricular activation sequences were computed during native rhythm as well as during ventricular pacing using a bidomain theory-based heart model to solve the related inverse problem. During right ventricular (RV) pacing control patients showed a deterioration of the ventricular activation sequence similar to the intrinsic activation pattern of CHF patients. Left ventricular propagation velocities were significantly decreased in CHF patients as compared to the control group (1.6±0.4 versus 2.1±0.5 m/sec; p<0.05). CHF patients showed right-to-left septal activation with the latest activation epicardially in the lateral wall of the left ventricle. Biventricular pacing resulted in a resynchronization of the ventricular activation sequence and in a marked decrease of total LV activation duration as compared to intrinsic conduction and RV pacing (129±16 versus 157±28 and 173±25 ms; both p<0.05).
Conclusions/significance: Endocardial and epicardial ventricular activation can be visualized noninvasively by NICE. Identification of individual ventricular activation properties may help identify responders to CRT and to further improve response to CRT by facilitating a patient-specific lead placement and device programming.
Conflict of interest statement
Figures
References
-
- Cleland JG, Daubert JC, Erdmann E, Freemantle N, Gras D, et al. The effect of cardiac resynchronization on morbidity and mortality in heart failure. N Engl J Med. 2005;352:1539–49. - PubMed
-
- Auricchio A, Fantoni C, Regoli F, Carbucicchio C, Goette A, et al. Characterization of left ventricular activation in patients with heart failure and left bundle-branch block. Circulation. 2004;109:1133–9. - PubMed
-
- Fantoni C, Kawabata M, Massaro R, Regoli F, Raffa S, et al. Right and left ventricular activation sequence in patients with heart failure and right bundle branch block: a detailed analysis using three-dimensional non-fluoroscopic electroanatomic mapping system. J Cardiovasc Electrophysiol. 2005;16:112–9. - PubMed
-
- Tilg B, Fischer G, Modre R, Hanser F, Messnarz B, et al. Model-based imaging of cardiac electrical excitation in humans. IEEE Trans Med Imaging. 2002;21:1031–9. - PubMed
-
- Modre R, Tilg B, Fischer G, Hanser F, Messnarz B, et al. Atrial noninvasive activation mapping of paced rhythm data. J Cardiovasc Electrophysiol. 2003;14:712–9. - PubMed
Publication types
MeSH terms
LinkOut - more resources
Full Text Sources
Medical
Research Materials
