. 2011 Jan 26;6(1):e16422.
doi: 10.1371/journal.pone.0016422.

A novel role for ATM in regulating proteasome-mediated protein degradation through suppression of the ISG15 conjugation pathway

Affiliations

A novel role for ATM in regulating proteasome-mediated protein degradation through suppression of the ISG15 conjugation pathway

Laurence M Wood et al. PLoS One. .

Abstract

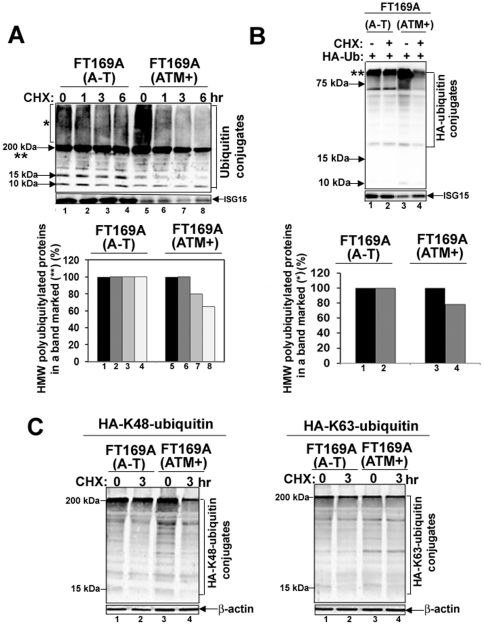
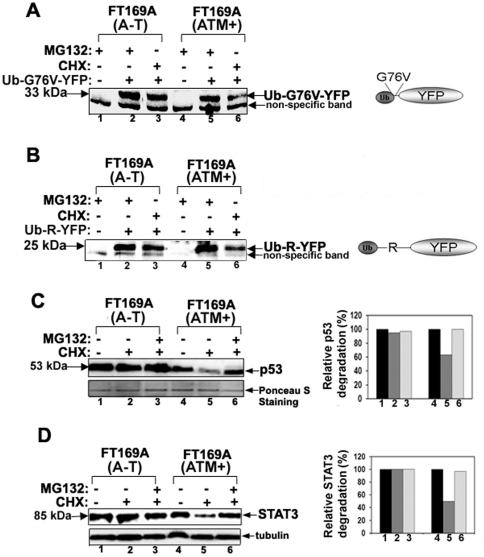
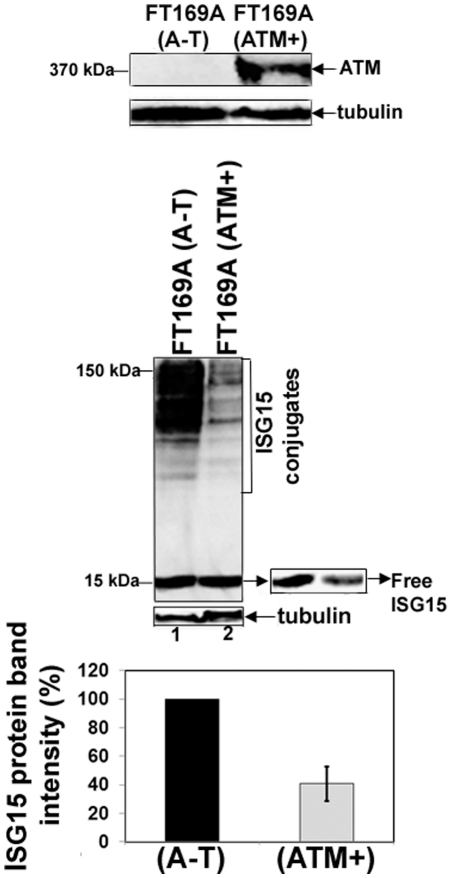
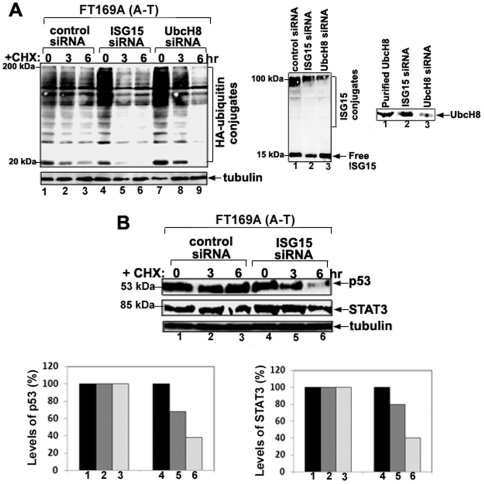
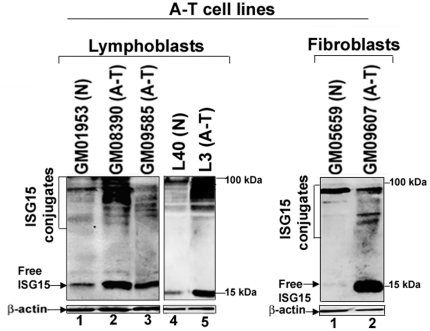
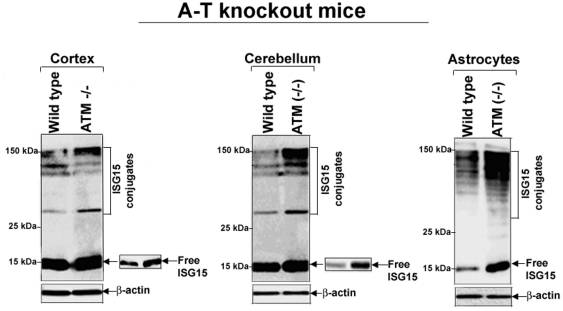
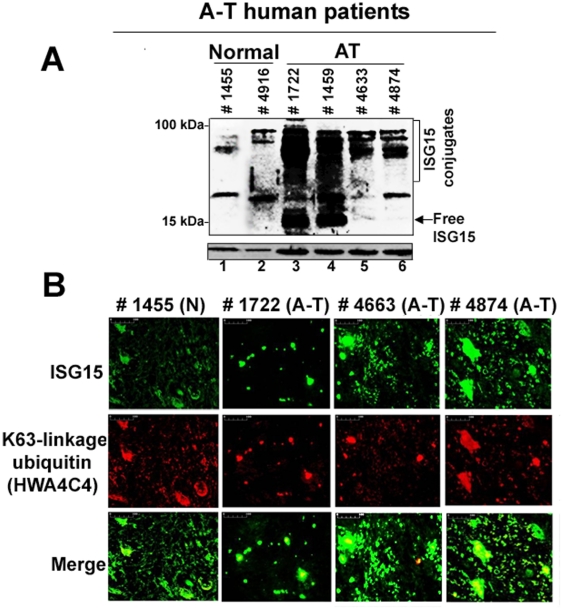
Ataxia Telangiectasia (A-T) is an inherited immunodeficiency disorder wherein mutation of the ATM kinase is responsible for the A-T pathogenesis. Although the precise role of ATM in A-T pathogenesis is still unclear, its function in responding to DNA damage has been well established. Here we demonstrate that in addition to its role in DNA repair, ATM also regulates proteasome-mediated protein turnover through suppression of the ISG15 pathway. This conclusion is based on three major pieces of evidence: First, we demonstrate that proteasome-mediated protein degradation is impaired in A-T cells. Second, we show that the reduced protein turnover is causally linked to the elevated expression of the ubiquitin-like protein ISG15 in A-T cells. Third, we show that expression of the ISG15 is elevated in A-T cells derived from various A-T patients, as well as in brain tissues derived from the ATM knockout mice and A-T patients, suggesting that ATM negatively regulates the ISG15 pathway. Our current findings suggest for the first time that proteasome-mediated protein degradation is impaired in A-T cells due to elevated expression of the ISG15 conjugation pathway, which could contribute to progressive neurodegeneration in A-T patients.


Conflict of interest statement

Competing Interests: The authors have declared that no competing interests exist.

Figures

Figure 1
Figure 1. Protein turnover is reduced in A-T cells.
A. FT169A (A-T) (lanes 1–4) and FT169A (ATM+) (lanes 5-8) cells were treated with the protein synthesis inhibitor CHX (10 µg/ml) for 0, 1, 3, and 6 hours. Cell lysates were analyzed using discontinuous (5%/15%) SDS-PAGE followed by immunoblotting with anti-ubiquitin antibody. The symbols * and ** mark the position of high-molecular-weight (HMW) polyubiquitylated proteins. Quantitation of the high-molecular-weight (HMW) polyubiquitylated proteins (shown as **) is shown in the bar graph. B. FT169A (A-T) (lanes 1 and 2) and FT169A (ATM+) (lanes 3 and 4) cells were transfected with HA-ubiquitin as described in Methods. Forty-eight hours post-transfection, cells were treated with the protein synthesis inhibitor CHX (marked on top of each lane) for 6 hours. Cell lysates were analyzed using 15% SDS-PAGE followed by immunoblotting with anti-HA antibody. The symbol ** marks the position of polyubiquitylated proteins (compressed due to the gel electrophoresis conditions). Quantitation of the high-molecular-weight (HMW) polyubiquitylated proteins (shown as **) is shown in the bar graph. C. FT169A (A-T) and FT169A (ATM+) cells were transfected with HA-Lys48-only (left panel) and Lys63-only (right panel) ubiquitin constructs. Thirty hours post-transfection, cells were treated with the protein synthesis inhibitor CHX (marked on the top of each lane) for 3 hours and then analyzed by immunoblotting with anti-HA antibodies as described above. All the experiments were repeated at least three times and the representative experiments are shown.
Figure 2
Figure 2. The 26S proteasome-mediated turnover of proteins is impaired in A-T cells.
A and B. FT169A (A-T) and FT169A (ATM+) cells transfected with fluorescent reporter proteasome substrates (the ubiquitin fusion degradation substrate, UbG76V -YFP (panel A), and the N-end rule substrate, ubiquitin-arginine-YFP (Ub-R-YFP) (panel B) for 12 hours. Proteasome inhibitor MG132 (0.5 µM) was then added to the transfection medium and cells were allowed to grow for an additional 12 hours. After washing (to remove MG132), cells were treated with protein synthesis inhibitor CHX (10 µg/ml) for 3 hours. The fluorescent reporter levels were detected with GFP antibodies. C. FT169A (A-T) and FT169A (ATM+) cells were treated with the protein synthesis inhibitor CHX (10 µg/ml) in the presence (lanes 3 and 6) or absence (lanes 2 and 5) of the proteasome inhibitor MG132 (10 µM) for 6 hours. Cell lysates were analyzed by immunoblotting using an anti-p53 antibody (upper panel). The intensity of the p53 bands was measured using a Kodak Image station 2000R (BioRad). Results are shown in a bar graph (right panel). The filter used for immunoblotting was stained with Ponceau S to assure equal protein loading (lower panel). D. FT169A (A-T) (lanes 1-3) and FT169A (ATM+) (lanes 4–6) cells were treated with the protein synthesis inhibitor CHX (10 µg/ml) in the presence (lanes 3 and 6) or absence (lanes 2 and 5) of the proteasome inhibitor MG132 (10 µM) for 6 hours. Cell lysates were analyzed by immunoblotting using an anti-STAT3 antibody as described above. Intensity of the STAT3 band was measured using Kodak Image station 2000R (BioRad). Results are shown in a bar graph (right panel). The lower portion of the same membrane filter was immunostained with the anti-tubulin (lower panel) antibody. All of the experiments were repeated at least three times and the representative experiments are shown.
Figure 3
Figure 3. ATM negatively regulates the ISG15 pathway.
Extracts of FT169A (A-T) and FT169A (ATM+) cells were analyzed by 5% (top panel) or 15% (middle panel) SDS-PAGE, followed by immunoblotting using either anti-ATM (top panel) or anti-ISG15 antibody (middle panel). The same membrane shown in the second panel was stripped and re-probed with anti-tubulin antibody to assure equal protein loading. Average band intensity of the free ISG15 protein (error bar represents SEM) from three independent experiments was quantified using Kodak Image Station 2000R and the results are shown in the bar graph.
Figure 4
Figure 4. siRNA-mediated knockdown of ISG15 and UbcH8 increases protein polyubiquitylation and degradation in A-T cells.
A. FT169A (A-T) cells were treated with either control (lanes 1–3), ISG15 (lanes 4–6) or UbcH8 (lanes 7–9) siRNAs for 72 hours followed by transfection with an HA-ubiquitin expression vector for 24 hours. Cells were treated with protein synthesis inhibitor CHX (10 µg/ml) for various times (lanes 2, 3, 5, 6, 8 and 9). Cells were then lysed with 2x SDS gel sample buffer. Cell lysates were then analyzed by immunoblotting using anti-HA antibody (first upper panel). The same membrane shown in the first upper panel was stripped and re-probed with anti-tubulin antibody to assure equal protein loading (first lower panel). The same samples shown in lanes 1, 4, and 7 were reloaded on a separate gel (15%), followed by immmunoblotting using an anti-ISG15 antibody (middle panel). The same samples shown in lanes 1 and 7 along with purified UbcH8 enzyme were reloaded on a separate gel (15%), followed by immmunoblotting using the anti-UbcH8 antibody (right panel). B. FT169A (A-T) cells were transfected with ISG15 siRNA for 72 hours. Cells were then treated with the protein synthesis inhibitor CHX (10 µg/ml) for 3 and 6 hours. Cell lysates were then analyzed by immunoblotting using anti-p53 (top panel), anti-STAT3 (middle panel) or anti-tubulin (lower panel) antibodies. The p53 and STAT3 bands shown in the first and second panels were quantified using the Kodak Image Station 2000R (see respective bar graphs). All the experiments were repeated at least three times and the representative experiments are shown.
Figure 5
Figure 5. Elevated expression of ISG15 and its conjugates in A-T cells.
Normal (N) and Ataxia Telangiectasia (A-T) lymphoblast (left panel) and fibroblast (right panel) cells were analyzed by 15% SDS-PAGE, followed by immunoblotting using anti-ISG15 antibody (upper panels). The same membrane shown in the upper panels was stripped and re-probed using anti-β-actin antibody (lower panels). The experiment was repeated at least three times and the representative experiment is shown.
Figure 6
Figure 6. ISG15 and its conjugates are elevated in brain tissues obtained from ATM knockout mice.
Lysates from cortex (left panel) and cerebellum (middle panel) tissues, as well as primary cortical astrocytes (right panel), were immunoblotted using anti-ISG15 antibodies as described in Material and Methods. All membrane filters were immunostained with anti-tubulin antibody (lower panels). The brain tissue lysates of two animals were pooled and loaded on SDS-PAGE. The experiment was repeated two times with reproducible results.
Figure 7
Figure 7. Elevated expression of ISG15 and its conjugates in mid-brain tissues obtained from human A-T patients.
A. Frozen mid-brain postmortem tissues from two normal individual (UMB# 1455 and 4916) and four A-T patients (UMB #s 1722, 1459, 4663 and 4874) were weighed and sonicated in a SDS sample buffer. Sonicated samples were immediately boiled for 10 min at 100°C and centrifuged at 13,000×g for 10 min. Cleared supernatants were analyzed using anti-ISG15 antibodies. As a loading control, lysates were also immunoblotted aganist β-actin. B. The deparaffinized human brain tissue sections from the normal subject (UMB# 1455) and A-T patients (UMB# 1722, 4663) described in A. were double stained with anti-ISG15 (polyclonal) and anti-K63-linkage specific polyubiquitin (monoclonal) (1∶100) antibodies. After washing with PBS, sections were stained with Alexa Fluor 488 goat anti-rabbit IgG secondary antibody to detect ISG15 (green) and goat polyclonal secondary antibody to mouse IgG (Cy5®) to detect Lys63-linked polyubiquitin conjugated proteins (red). Sections were mounted in gold antifade mounting medium and examined using Nikon E600 epifluorescence microscope (Nikon) (20× magnification, scale bar, 100 um). One slide each of the deparaffinized human brain tissue sections of A-T patients and normal individuals (obtained from the NICHD Brain and Tissue Bank for Developmental Disorders at the University of Maryland) was used in the experiment. Arrows indicate ubiquitin/ISG15 double-positive inclusions in the A-T brain sections.

Similar articles

Cited by

References

    1. Chun HH, Gatti RA. Ataxia-telangiectasia, an evolving phenotype. DNA Repair (Amst) 2004;3:1187–1196. - PubMed
    1. Lavin MF, Scott S, Gueven N, Kozlov S, Peng C, et al. Functional consequences of sequence alterations in the ATM gene. DNA Repair (Amst) 2004;3:1197–1205. - PubMed
    1. McKinnon PJ. ATM and ataxia telangiectasia. EMBO Rep. 2004;5:772–776. - PMC - PubMed
    1. Boder E. Ataxia-telangiectasia: an overview. Kroc Found Ser. 1985;19:1–63. - PubMed
    1. Jentsch S, Pyrowolakis G. Ubiquitin and its kin: how close are the family ties? Trends Cell Biol. 2000;10:335–342. - PubMed

Publication types