. 2011 Jan 27;7(1):e1001067.
doi: 10.1371/journal.pcbi.1001067.

Impact of sarcoplasmic reticulum calcium release on calcium dynamics and action potential morphology in human atrial myocytes: a computational study

Affiliations

Impact of sarcoplasmic reticulum calcium release on calcium dynamics and action potential morphology in human atrial myocytes: a computational study

Jussi T Koivumäki et al. PLoS Comput Biol. .

Abstract

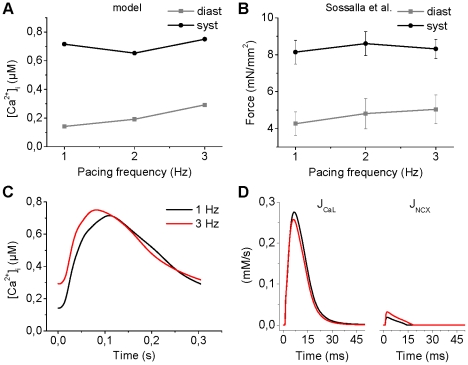
Electrophysiological studies of the human heart face the fundamental challenge that experimental data can be acquired only from patients with underlying heart disease. Regarding human atria, there exist sizable gaps in the understanding of the functional role of cellular Ca²+ dynamics, which differ crucially from that of ventricular cells, in the modulation of excitation-contraction coupling. Accordingly, the objective of this study was to develop a mathematical model of the human atrial myocyte that, in addition to the sarcolemmal (SL) ion currents, accounts for the heterogeneity of intracellular Ca²+ dynamics emerging from a structurally detailed sarcoplasmic reticulum (SR). Based on the simulation results, our model convincingly reproduces the principal characteristics of Ca²+ dynamics: 1) the biphasic increment during the upstroke of the Ca²+ transient resulting from the delay between the peripheral and central SR Ca²+ release, and 2) the relative contribution of SL Ca²+ current and SR Ca²+ release to the Ca²+ transient. In line with experimental findings, the model also replicates the strong impact of intracellular Ca²+ dynamics on the shape of the action potential. The simulation results suggest that the peripheral SR Ca²+ release sites define the interface between Ca²+ and AP, whereas the central release sites are important for the fire-diffuse-fire propagation of Ca²+ diffusion. Furthermore, our analysis predicts that the modulation of the action potential duration due to increasing heart rate is largely mediated by changes in the intracellular Na+ concentration. Finally, the results indicate that the SR Ca²+ release is a strong modulator of AP duration and, consequently, myocyte refractoriness/excitability. We conclude that the developed model is robust and reproduces many fundamental aspects of the tight coupling between SL ion currents and intracellular Ca²+ signaling. Thus, the model provides a useful framework for future studies of excitation-contraction coupling in human atrial myocytes.


Conflict of interest statement

The authors have declared that no competing interests exist.

Figures

Figure 1
Figure 1. The human atrial myocyte model.
(A) Membrane currents and a schematic overview of the model. The SL currents presented by the model are the transient outward K+ current (I to), the slow delayed rectifier K+ current (I Ks), the rapid delayed rectifier K+ current (I Kr), the sustained outward K+ current (I sus), the time-independent K+ current (I K1), the hyperpolarization-activated inward K+ current (I f), the fast Na+ current (I Na), the L-type Ca2+ current (I CaL), the PMCA, NKA, NCX, and the Na+ and Ca2+ background currents (I Nab and I Cab). (B) The geometry and SR structure of the model. The intracellular cytosol is divided into the junctional and bulk cytosols. The former is a 0.02 µm deep region below the cell membrane, and the latter represents the rest of the cytosol below the junctional cytosol. The bulk cytosol and the SR are divided into four compartments that are 1.625 µm deep; note: each red entity contains RyR, SERCA, and SR leak. The RyR and SERCA in the first SR compartment interact with the LTCC in the junctional cytosol compartment, whereas the RyRs and SERCAs in the other three SR compartments interact with the corresponding cytosolic compartments. This scheme replicates the structure seen in immunolabeleled images of RyRs and SERCAs in atrial myocytes, in which the non-junctional release sites form a regular structure with ∼2 µm distances and the junctional release site is apart from this structure , .
Figure 2
Figure 2. The RyR model characteristics.
(A) The steady-state probabilities of open (green) and closed (red) gates are shown as a function of intracellular [Ca2+] for two illustrative states of adaptation. The time constant τ refers to the adaptation that modulates the steady-state probabilities of open and closed gates. (B) The effect of RyR adaptation. When the adaptation is not inhibited (left) the dependence of the RyR open probability (y axis) on the intracellular Ca2+ adapts in line with experimental findings , . Inset shows the dynamics of the open and closed gate in the control situation. The 0.33-fold Ca2+ was implemented by reducing the maximal currents/rates of the NCX, SERCA and PMCA to 33% of control.
Figure 3
Figure 3. Ca2+ dynamics of the model.
(A) The Ca2+ transients at different parts of the cytosol differ from the average cytosolic Ca2+ signal. The x-coordinates of the compartments are as follows: subspace 0.01 µm, bulk1 = 0.8325 µm, bulk2 = 2.4575 µm, bulk3 = 4.0825 µm, and bulk4 = 5.7075 µm; SL = 0 µm. (B) Spatiotemporal representation of [Ca2+] demonstrates clearly the divergence of both the amplitude and delay of Ca2+ release in different parts of the cytosol. (C) and (D) The model reproduces the experimentally found biphasic increment during the upstroke of the global Ca2+ transient . (E) Release rates of the two phases of the Ca2+ transient in experiments by Hatem et al. and simulations. The two values of release rates (arrows in (C) indicate the stages of release) were obtained with a linear fit to normalized Ca2+ transients.
Figure 4
Figure 4. SR Ca2+ dynamics of the model.
(A) and (B) Inhibition of the SR Ca2+ release with ryanodine greatly reduces the Ca2+ transient amplitude in both experiments and simulations. Detailed analysis indicates that the SR Ca2+ release generates 77% of the Ca2+ transient amplitude, which is in line with the experimental findings 79±6% of Hatem et al. . (C) and (D) Most of the Ca2+ release is generated from the junctional compartment. (E) and (F) During the uptake of Ca2+ from the cytosol to the SR, the SERCA buffers the Ca2+ and generates a delay in the fluxes between the cytosol to SERCA and SERCA to SR. At the end of the diastolic phase, there is some diffusion of Ca2+ in the SR, which balances the concentration differences in different parts of the SR.
Figure 5
Figure 5. Role of the junctional vs. bulk SR Ca2+ release sites in the ECC.
(A) Inhibition of the release sites (at t = 1 s) in the bulk cytosol has only a small impact on the ECC. The amplitude of the global Ca2+ transient is decreased by 31%. The Ca2+ signal becomes relatively inhomogeneous and it is not carried at all to the center of the cell. (B) The abnormal Ca2+ dynamics also affect the AP: APD90 is shortened by 10%. Since there is less Ca2+ to be extruded, the I NCX is reduced. (C) Inhibition of the junctional SR Ca2+ release site (at t = 1 s) has a profound effect on the ECC. The amplitude of the global Ca2+ transient is decreased by 58%. Without the junctional SR Ca2+ release, the Ca2+ influx via the L-type Ca2+ channels is too weak to trigger the CICR at the first release site in the bulk cytosol. Thus, the inhibition of the junctional release results in a failure in the propagation of the Ca2+ signal. (D) The APD90 is shortened by 34%. Due to the lower [Ca2+]i in the junctional compartment, the depolarizing I NCX is not activated to the normal level.
Figure 6
Figure 6. Effect of SR Ca2+ release on APD and refractoriness.
(A) Modulation of SR Ca2+ release (total block, blue; normal, black; triple release, red) has a dramatic effect on the mean cytosolic Ca2+ transient. (B) Increased release promotes slower initial (inset: zoomed to the first 75 ms) and faster late repolarization of the membrane voltage, whereas blocking the release generates opposite changes. (C) The SR Ca2+ release is an important factor for the refractoriness of the cell. Increased SR Ca2+ release can block the second AP (interval 200 ms). Note that the second peak that is seen in the AP trace (red line) is caused by the stimulus current, i.e., there is no actual second AP. (D) Refractoriness is caused by blocking the I Na, which is shown more clearly in the inset.
Figure 7
Figure 7. Effect of the amplitude and decay of the junctional Ca2+ transient on APD.
(A) The junctional Ca2+ transient was clamped to three different decay modes (slowed decay, blue; normal decay, black; accelerated decay, red) with analytical functions. (B) Modulating the decay of the junctional Ca2+ transient has a pronounced effect on the APD (inset: zoomed to the first 75 ms). (C) The modulatory effect is mainly mediated by the changes in the late phase of I NCX. The late current increases/decreases with faster/slower decay of the Ca2+ transient, respectively. (D) The modulation of Ca2+ transient decay has no significant effect on the inactivation the I CaL. (E) To mimic the modulation of RyR (decreased release, blue; normal release, black; increased release, red), the junctional Ca2+ transient was clamped to three different amplitude modes (inset). (F) Increasing the amplitude of the junctional Ca2+ transient accelerates the early repolarization and decelerates the late repolarization of the AP (inset: zoomed to the first 75 ms), while a decreased amplitude has an opposite effect. G) The modulatory effect of the Ca2+ transient amplitude is mainly mediated by the changes in the initial phase of I NCX. The late current increases with faster and decreases with slower decay of the Ca2+ transient. (H) The modulation of Ca2+ transient amplitude also affects the inactivation the I CaL.
Figure 8
Figure 8. Role of Na+ accumulation in the rate dependence of the AP.
The myocyte was paced as previously with a stepwise reduction in BCL, and corresponding AP characteristics were defined for each BCL. (A) Shortening of the BCL increases both the subsarcolemmal and cytosolic [Na+], especially at BCLs 400 ms and 300 ms. (B) The values of APD30 calculated from simulations are compared to those reported by Dawodu et al. , and Neef et al. . (C) The steep dependence of APD90 on the BCL reported by Dawodu et al. , Bosch et al. and Dobrev & Ravens is reproduced by the model. (D) Continued fast pacing starting from a quiescent steady-state results in a dramatic accumulation of intracellular Na+. (E) APD adaptation in control situation conditions and [Na+]i “clamped” to the quiescent steady-state value. (F) AP shape at BCLs 1600, 800 and 400 ms after 5 minutes of pacing starting from a quiescent steady-state. (G) Accumulation of Na+ due to fast pacing, continued for 5 minutes, increases Na+/K+-ATPase current (I NKA) substantially.
Figure 9
Figure 9. Rate dependence of Ca2+ dynamics.
The myocyte was paced as previously with a pacing frequencies , , Hz. Each pacing frequency was applied for 5 minutes in a continuous stimulus train. Rate dependence of Ca2+ dynamics (A) matches qualitatively to the force-frequency relation (B) reported by Sossalla et al. . (C) Changes of Ca2+ transient dynamics in response to fast pacing. (D) Ca2+ influx via the reverse mode of the NCX (right panel) increases substantially during fast pacing, whereas the influx via the LTCC is decreased slightly (left panel).

Similar articles

Cited by

References

    1. Bers DM. Excitation-contraction coupling and cardiac contractile force. Dordrecht ; Boston: Kluwer Academic Publishers; 2001. p. xxiv, 427.
    1. Fabiato A. Calcium-induced release of calcium from the cardiac sarcoplasmic reticulum. Am J Physiol Cell Physiol. 1983;245:C1–14. - PubMed
    1. Tanaami T, Ishida H, Seguchi H, Hirota Y, Kadono T, et al. Difference in propagation of Ca2+ release in atrial and ventricular myocytes. Jpn J Physiol. 2005;55:81–91. - PubMed
    1. Walden AP, Dibb KM, Trafford AW. Differences in intracellular calcium homeostasis between atrial and ventricular myocytes. J Mol Cell Cardiol. 2009;46:463–473. - PubMed
    1. Brette F, Orchard C. T-tubule function in mammalian cardiac myocytes. Circ Res. 2003;92:1182–1192. - PubMed

Publication types