

Erratic flu vaccination emerges from short-sighted behavior in contact networks
- PMID: 21298083
- PMCID: PMC3029241
- DOI: 10.1371/journal.pcbi.1001062
Erratic flu vaccination emerges from short-sighted behavior in contact networks
Abstract
The effectiveness of seasonal influenza vaccination programs depends on individual-level compliance. Perceptions about risks associated with infection and vaccination can strongly influence vaccination decisions and thus the ultimate course of an epidemic. Here we investigate the interplay between contact patterns, influenza-related behavior, and disease dynamics by incorporating game theory into network models. When individuals make decisions based on past epidemics, we find that individuals with many contacts vaccinate, whereas individuals with few contacts do not. However, the threshold number of contacts above which to vaccinate is highly dependent on the overall network structure of the population and has the potential to oscillate more wildly than has been observed empirically. When we increase the number of prior seasons that individuals recall when making vaccination decisions, behavior and thus disease dynamics become less variable. For some networks, we also find that higher flu transmission rates may, counterintuitively, lead to lower (vaccine-mediated) disease prevalence. Our work demonstrates that rich and complex dynamics can result from the interaction between infectious diseases, human contact patterns, and behavior.
Conflict of interest statement
The authors have declared that no competing interests exist.
Figures
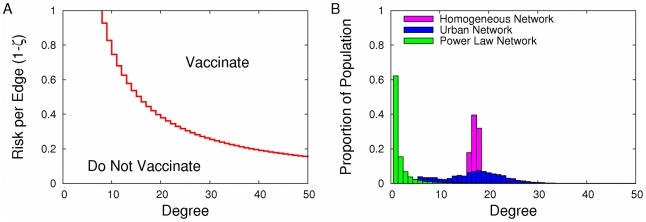
 ). (B) The proportion of the population with each given degree are different for a homogeneous network (magenta histogram), an urban network (blue bimodal histogram), and an exponentially-scaled power-law network (steeply descending green histogram). For a log-linear plot of the degree distributions, see the online supplement.
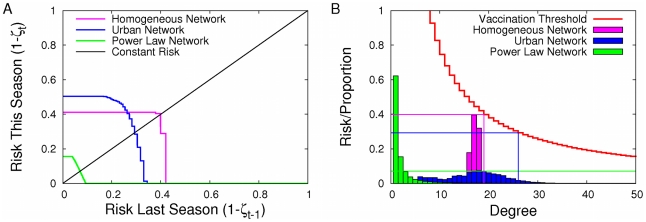
 indicates constant level of risk from one season to the next, and an intersection of the response risk curve with this line represents a Nash Equilibrium. The stairstep shape seen in the homogeneous and urban networks is also present in the power-law example but appears smooth here as the steps are very small in comparison to the line width. (B) Each of these intersection points corresponds to an equilibrium level of risk (horizontal lines) and vaccination threshold degrees (vertical lines). Both figures assume that transmissibility is
  .
.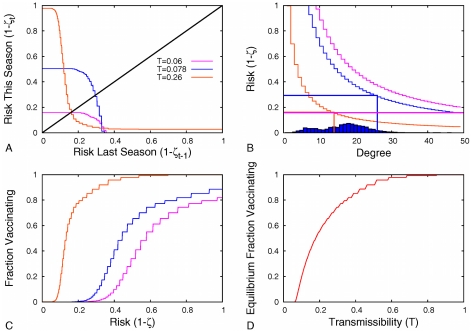
 ) line. (B) As the transmissibility increases, the equilibrium vaccination threshold and risk change non-monotonically. For low T (
 , magenta) the equilibrium level of risk is less than 0.2 per year, and the vaccination threshold is greater than the maximum degree in the network. Consequently, nobody in the population is expected to vaccinate. For intermediate T (
 , blue), the equilibrium risk is near 0.5 per year and only a small fraction of the most connected individuals vaccinate. At high T (
 , orange), a large fraction of individuals vaccinate, leaving an intermediate level of risk. (C) As both risk and transmissibility increase, vaccination behavior increases. (D) Consequently, the equilibrium level of vaccination is an increasing function of the transmission rate.
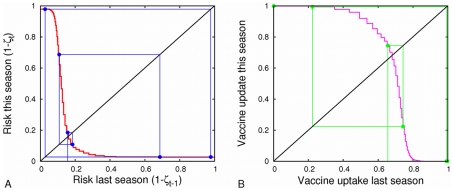
 and
and  . Whether vaccination rate (or
  ) is stable from season to season depends on the slope of the inter-seasonal risk relation at the equilibrium (the slope of the intersections above or likewise in Figures 2A and 3A. When this slope is zero, there is a partially vaccinating degree class at equilibrium and the system is dynamically unstable, and otherwise (infinite slope) there are no partially vaccinating classes and it is dynamically stable. Additionally, when the “average” slope has magnitude less than one, the system is convergently stable. Conversely, if the magnitude of the average slope is greater than one, it is not convergently stable. The dynamics shown are both dynamically and convergently unstable.
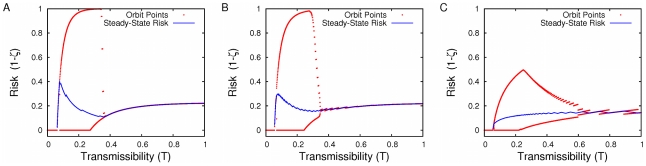
 and
and  ; some individuals waver between accepting and rejecting vaccination.
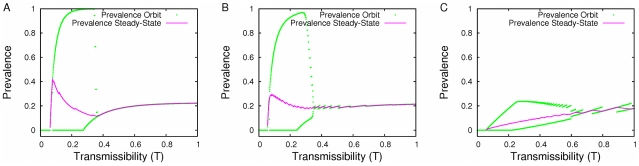
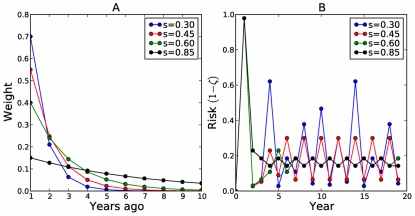
 : longer memory decreases variability.
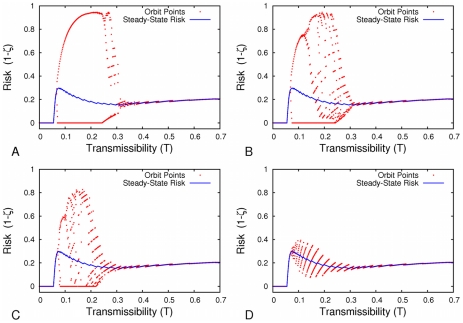
 increases, individuals integrate more of their prior epidemiological experiences into their decision-making and two-cycles disappear. (A)
  (B)
(B)  (C)
(C)  (D)
(D)  .
.References
-
- Del Valle S, Hethcote H, Hyman JM, Castillo-Chavez C. Effects of behavioral changes in a smallpox attack model. Math Biosci. 2005;195:228–251. - PubMed
Publication types
MeSH terms
Substances
Grants and funding
LinkOut - more resources
Full Text Sources
Medical
Miscellaneous
