. 2011 Jan 26;6(1):e16031.
doi: 10.1371/journal.pone.0016031.

A novel method for volumetric MRI response assessment of enhancing brain tumors

Affiliations

A novel method for volumetric MRI response assessment of enhancing brain tumors

Charles W Kanaly et al. PLoS One. .

Abstract

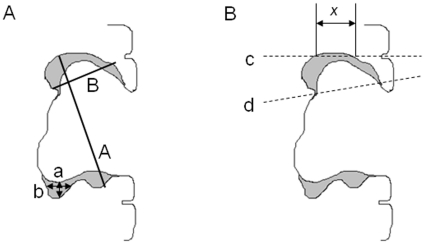
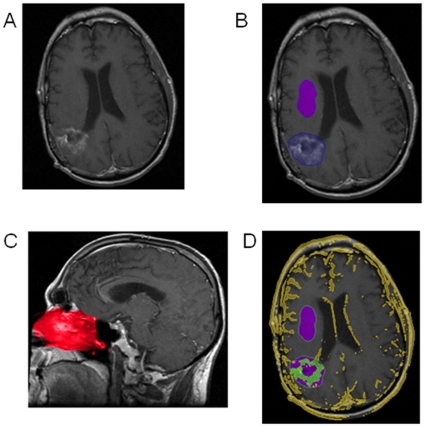
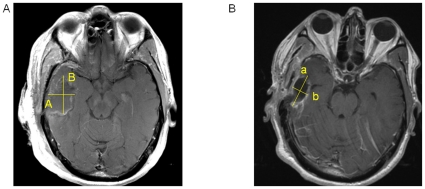
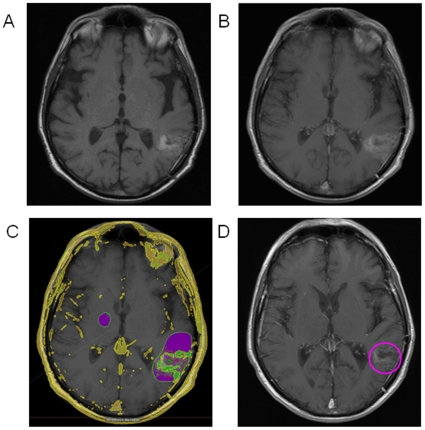
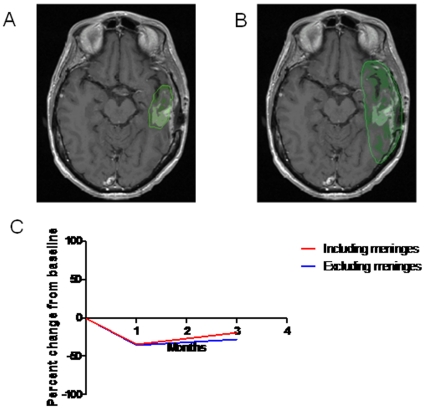
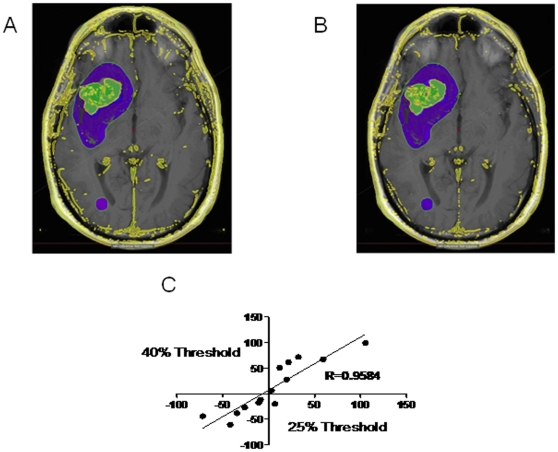
Current radiographic response criteria for brain tumors have difficulty describing changes surrounding postoperative resection cavities. Volumetric techniques may offer improved assessment, however usually are time-consuming, subjective and require expert opinion and specialized magnetic resonance imaging (MRI) sequences. We describe the application of a novel volumetric software algorithm that is nearly fully automated and uses standard T1 pre- and post-contrast MRI sequences. T1-weighted pre- and post-contrast images are automatically fused and normalized. The tumor region of interest is grossly outlined by the user. An atlas of the nasal mucosa is automatically detected and used to normalize levels of enhancement. The volume of enhancing tumor is then automatically calculated. We tested the ability of our method to calculate enhancing tumor volume with resection cavity collapse and when the enhancing tumor is obscured by subacute blood in a resection cavity. To determine variability in results, we compared narrowly-defined tumor regions with tumor regions that include adjacent meningeal enhancement and also compared different contrast enhancement threshold levels used for the automatic calculation of enhancing tumor volume. Our method quantified enhancing tumor volume despite resection cavity collapse. It detected tumor volume increase in the midst of blood products that incorrectly caused decreased measurements by other techniques. Similar trends in volume changes across scans were seen with inclusion or exclusion of meningeal enhancement and despite different automated thresholds for tissue enhancement. Our approach appears to overcome many of the challenges with response assessment of enhancing brain tumors and warrants further examination and validation.


Conflict of interest statement

Competing Interests: The author Anthony F. Waller has a consulting relationship with Velocity Medical Solutions. Dr. Ian Crocker is a co-founder of Velocity Medical Solutions and is entitled to royalties on sales based upon an intellectual property agreement between Velocity and Emory University. This does not alter the authors' adherence to all the PLoS ONE policies on sharing data and materials.

Figures

Figure 1
Figure 1. Traditional Non-Volumetric Measurements do not Adequately Describe Residual Enhancement in Surgical Resection Cavities.
A) This schematic resection cavity has residual rim enhancement in gray. RECIST criteria measurement ‘A’ or ‘a’ or ‘b’ or Macdonald criteria measurement ‘A*B’ or ‘a*b’ would not adequately describe residual tumor volume and additional tumor growth around the rim or collapse of the resection cavity may be over- or under-interpreted. B) Differences in axial slice acquisition also impact measurements made by traditional criteria more than volumentric measurements. One scan could obtain axial slice ‘c’ with enhancing tumor measurement ‘x’ but a subsequent scan in the same patient could obtain axial slice ‘d’, causing an incorrect assessment of tumor response.
Figure 2
Figure 2. Automated Assessment of Enhancing Tumor Volume.
A) T1-weighted post-contrast axial images are automatically fused with the pre-contrast sequences. B) The tumor region of interest (blue area) and nearby normal brain (purple area) are outlined roughly by hand. C) The enhancing nasal mucosa region is automatically detected with a built-in anatomic atlas (red area) and serves as a threshold for enhancement. D) Tissue that is present on the post-contrast images but not the pre-contrast that is above the enhancement threshold appears in yellow. This includes enhancing tissue such as vasculature, tumor, and superficial structures. Enhancing tumor volume is defined as the green area within the manually-defined blue tumor region of interest.
Figure 3
Figure 3. Detection of Enhancing Tumor Volume Despite Resection Cavity Collapse.
A) T1-weighted post-contrast axial image showing a resection cavity with rim enhancement. RECIST measurement would be A and Macdonald measurement would be “A * B”. B) T1-weighted post-contrast axial image showing the same patient 3 months postoperatively who had collapse of his resection cavity. RECIST measurement would be “a” and Macdonald measurement would be “a * b”, both of which would be smaller than the measurements from the initial scan above, but this change would be describing only the resection cavity configuration and not the underlying tumor burden.
Figure 4
Figure 4. Detection of Enhancement that is Obscured by Blood Products.
A) Uncontrasted T1-weighted axial image showing resection cavity blood products (bright on T1). B) T1-weighted post-contrast axial image showing the difficulty in determining residual enhancing tumor. C) Our volumetric analysis is able to detect the obscured enhancing tumor tissue (shown in green). D) T1-weighted post-contrast axial image at 2.5 months later after the blood has resolved verifying the underlying enhancing tumor volume.
Figure 5
Figure 5. Effect of Inter-observer Differences in Definition of Tumor Volume.
A) Axial T1-weighted post-contrast image showing a limited user-defined tumor region of interest. B) The same axial image now showing a large user-defined tumor region of interest that encompasses the meningeal enhancement. C) While including the meninges increases the enhancing volume, similar trends in changes of volume over time are seen.
Figure 6
Figure 6. Effect of Different Enhancement Thresholds.
A) Axial T1-weighted post-contrast image after volumetric analysis has been performed which shows in green the detected enhancing tumor volume using a 25% threshold level. B) Detected enhancing tumor volume using a 40% threshold level. C) While increasing the threshold decreases the calculated tumor volume, the volumes across different threshold levels are highly correlated.

Similar articles

Cited by

References

    1. Jaffe CC. Measures of response: RECIST, WHO, and new alternatives. J Clin Oncol. 2006;24:3245–3251. - PubMed
    1. Sorensen AG, Batchelor TT, Wen PY, Zhang WT, Jain RK. Response criteria for glioma. Nat Clin Pract Oncol. 2008;5:634–644. - PMC - PubMed
    1. Suzuki C, Jacobsson H, Hatschek T, Torkzad MR, Boden K, et al. Radiologic measurements of tumor response to treatment: practical approaches and limitations. Radiographics. 2008;28:329–344. - PubMed
    1. Macdonald DR, Cascino TL, Schold SC, Jr, Cairncross JG. Response criteria for phase II studies of supratentorial malignant glioma. J Clin Oncol. 1990;8:1277–1280. - PubMed
    1. Therasse P, Arbuck SG, Eisenhauer EA, Wanders J, Kaplan RS, et al. New guidelines to evaluate the response to treatment in solid tumors. European Organization for Research and Treatment of Cancer, National Cancer Institute of the United States, National Cancer Institute of Canada. J Natl Cancer Inst. 2000;92:205–216. - PubMed

Publication types