. 2011 Jan 26;6(1):e16376.
doi: 10.1371/journal.pone.0016376.

Visceral adipose inflammation in obesity is associated with critical alterations in tregulatory cell numbers

Affiliations

Visceral adipose inflammation in obesity is associated with critical alterations in tregulatory cell numbers

Jeffrey Deiuliis et al. PLoS One. .

Abstract

Background: The development of insulin resistance (IR) in mouse models of obesity and type 2 diabetes mellitus (DM) is characterized by progressive accumulation of inflammatory macrophages and subpopulations of T cells in the visceral adipose. Regulatory T cells (Tregs) may play a critical role in modulating tissue inflammation via their interactions with both adaptive and innate immune mechanisms. We hypothesized that an imbalance in Tregs is a critical determinant of adipose inflammation and investigated the role of Tregs in IR/obesity through coordinated studies in mice and humans.

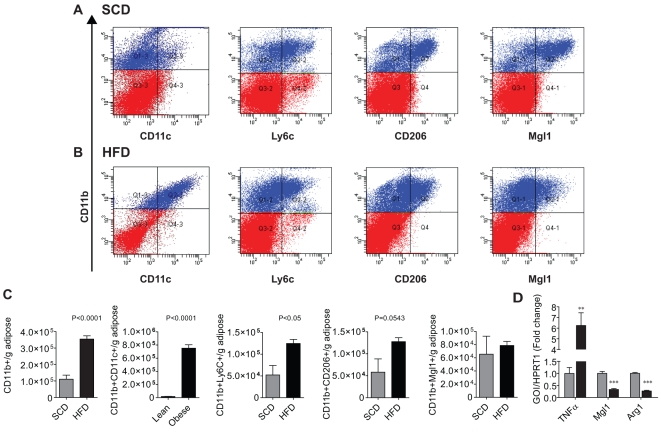
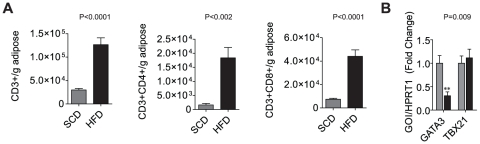
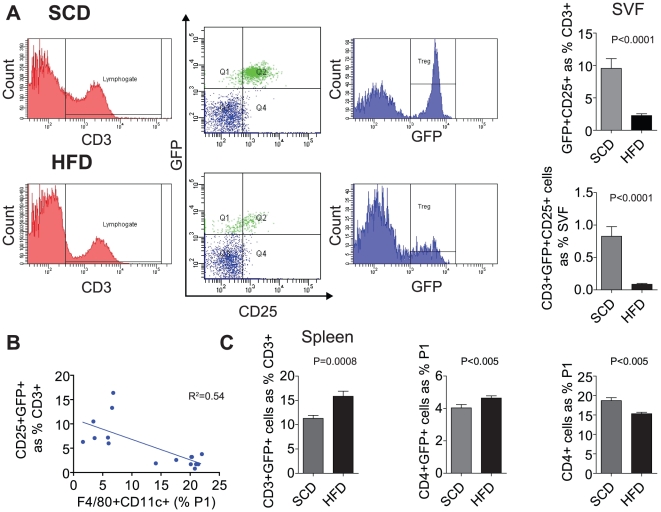
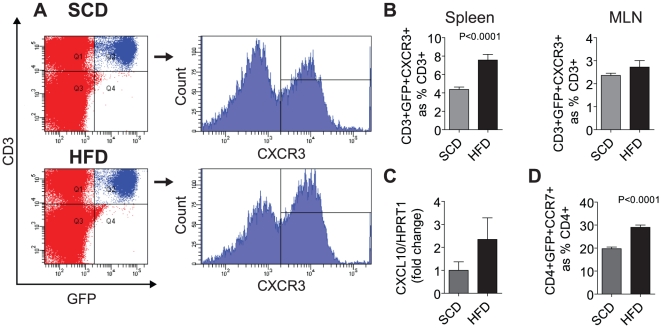
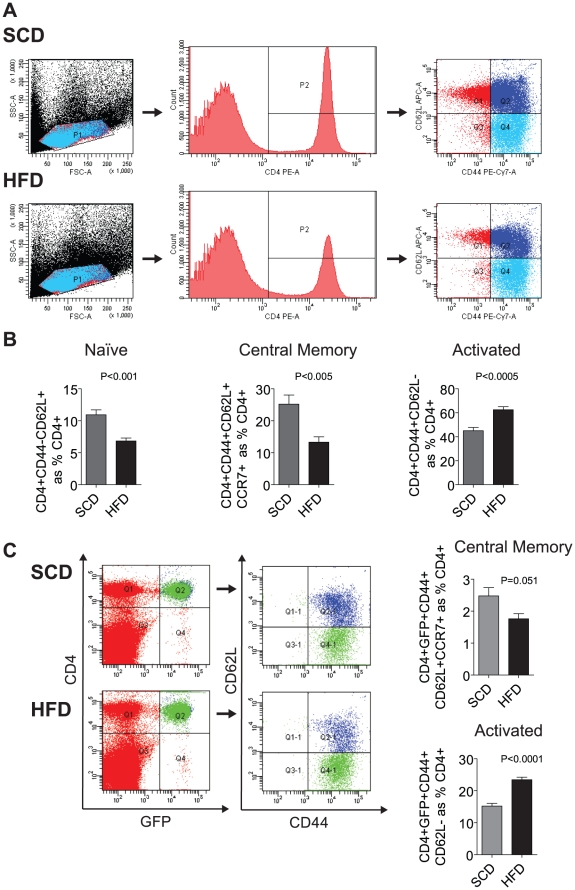
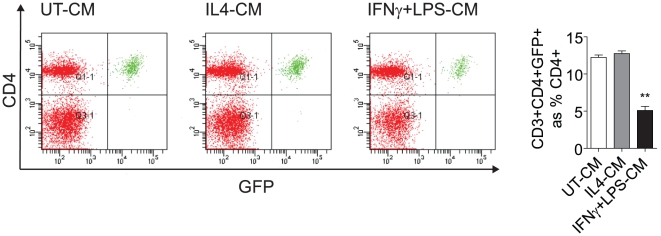
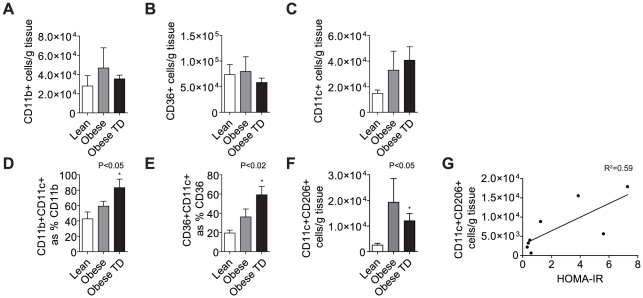
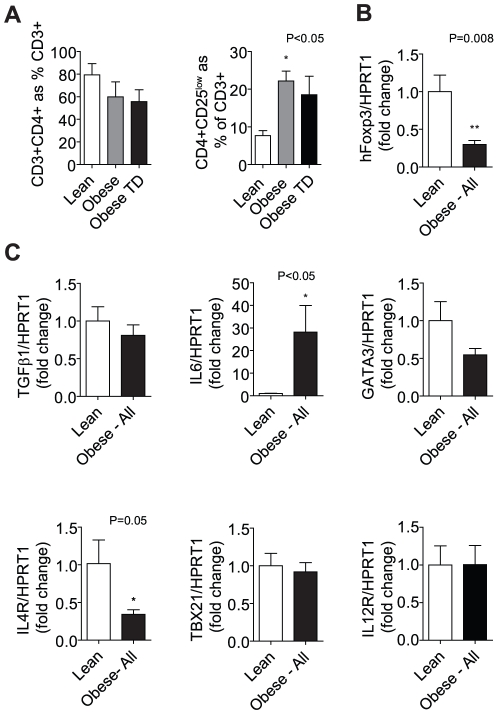
Methods and findings: Foxp3-green fluorescent protein (GFP) "knock-in" mice were randomized to a high-fat diet intervention for a duration of 12 weeks to induce DIO/IR. Morbidly obese humans without overt type 2 DM (n = 13) and lean controls (n = 7) were recruited prospectively for assessment of visceral adipose inflammation. DIO resulted in increased CD3(+)CD4(+), and CD3(+)CD8(+) cells in visceral adipose with a striking decrease in visceral adipose Tregs. Treg numbers in visceral adipose inversely correlated with CD11b(+)CD11c(+) adipose tissue macrophages (ATMs). Splenic Treg numbers were increased with up-regulation of homing receptors CXCR3 and CCR7 and marker of activation CD44. In-vitro differentiation assays showed an inhibition of Treg differentiation in response to conditioned media from inflammatory macrophages. Human visceral adipose in morbid obesity was characterized by an increase in CD11c(+) ATMs and a decrease in foxp3 expression.

Conclusions: Our experiments indicate that obesity in mice and humans results in adipose Treg depletion. These changes appear to occur via reduced local differentiation rather than impaired homing. Our findings implicate a role for Tregs as determinants of adipose inflammation.


Conflict of interest statement

Competing Interests: The authors have declared that no competing interests exist.

Figures

Figure 1
Figure 1. Diet-induced Obesity and Macrophage Inflammation in Mice.
Representative flow cytometric dot plots showing double positive ATMs from Foxp3gfp.KI mouse epididymal adipose (N = 10/group) (A & B). The monocyte macrophage marker (CD11b+; y axis) is shown versus inflammatory (CD11c, Ly6c) and putative anti-inflammatory (CD206, Mgl1) markers (x axis). Blue indicates CD11b positivity within the live singlet gate (P1), red indicates P1 cells negative for CD11b. (C) There was a significant increase in inflammatory ATMs (CD11c+; Ly6C+) per gram of epididymal fat. Putative anti-inflammatory markers were not significantly affected; however, CD206 expressing cells increased (p = 0.0543). (D) There was a significant (**; p<0.005) increase in TNFα gene expression in the stromal vascular fraction with HFD and a significant (***; p<0.0005) decrease in Mgl1 and Arg1 expression (N = 6/group) as measured by real time PCR.
Figure 2
Figure 2. Lymphocytic Infiltration of Visceral Adipose in Obese Mice.
(A) Flow cytometric staining for the lymphocytic markers CD3, CD4, and CD8 in Foxp3gfp.KI mice (N = 10/group) demonstrated a significant lymphocyte infiltration of the epididymal fat pad with obesity and insulin resistance. The CD8+ T cell population was >2-fold that of CD4+ per gram of adipose. (B) Gene expression of GATA3 and TBX21 in adipose-derived lymphoid cells from mouse epididymal fat following Lympholyte M isolation.
Figure 3
Figure 3. Obesity Mediates Local Treg Deficiency in the Visceral Adipose of Obese Mice.
Visceral Treg numbers were examined by flow cytometry. (A) CD3+ T cells were identified followed by quantification of CD25+FoxP3+ Tregs as shown in Q2 of representative dot plots. HFD mice showed a 4-fold decrease in Tregs proportional to total CD3+ T cells. When normalized to percent of SVF, CD3+GFP+CD25+ decreased ≅ 10-fold. (B) There is an inverse relationship between the CD11c+ inflammatory ATMs and Tregs (R2 = 0.54). (C) HFD resulted in a significant increase in splenic CD3+GFP+ and CD4+GFP+ Tregs, with a concomitant (p<0.005) decrease in total splenic CD4+ T cells.
Figure 4
Figure 4. Splenic Treg Homing Receptor Expression in Obesity.
The expression of receptors and cognate ligands involved in Treg homing were analyzed in the spleen and mesenteric lymph nodes (MLN, N = 10/group). (A) Representative dot-plot and histogram of Treg CXCR3 expression in SCD and HFD fed mice showing an increase in CXCR3 expressing Tregs in the spleen. (B) Analysis of splenic and mesenteric Tregs shows a non-significant increase in CXCR3 expression in splenic Tregs with no difference in MLN Tregs. (C) CXCL10 gene expression, the cognate ligand of CXCR3 receptor, was measure in the SVF of Foxp3gfp.KI mice. (D) Surface expression of the CCR7 receptor in splenic Tregs was significantly increased (p<0.0001) in the HFD group as measured by flow cytometry.
Figure 5
Figure 5. Diet-induced Obesity in Mice Activates Splenic T Helper and Tregs.
The effect of DIO on CD4+ (A–D) and Tregs (E–G) sub-populations. (A) Representative dot-plot demonstrating isolation of CD4+ cells and analysis of expression of CD44, CCR7 (central memory cells) and CD62L (activation marker). (B) DIO resulted in a decrease in central memory and naïve T helper cells (p<0.005; p<0.001, respectively) and an increase in activated cells (p<0.0005) (C). Representative dot-plots of CD4+, GFP+ Tregs, showing CD44, CCR7 and CD62L expression. Splenic central memory Tregs (CD44+CD62L+CCR7+) showed a decrease (p = 0.051) while activated splenic Treg (CD44+CD62L) were increased (p<0.0001).
Figure 6
Figure 6. Treg Differentiation is Inhibited by an Inflammatory Macrophage Milieu.
Splenic CD4+ cells from Foxp3gfp.KI were negatively selected in the presence of irradiated CD4 T cells, anti-mouse CD3ε antibody, and conditioned media from untreated, IL4-, or IFNγ+LPS-differentiated bone marrow-derived macrophages. Cells were cultured for 72 hours, collected, stained, and analyzed by flow cytometry for CD4 and GFP expression as a marker of Treg differentiation. The IFNγ+LPS-CM group showed a significant (**, p<0.005) decrease in in vitro Treg differentiation when compared to the UT-CM group.
Figure 7
Figure 7. Human Obesity Results in Inflammatory Macrophage Infiltration of the Greater Omentum.
ATMs were analyzed in the stromal vascular fraction of omental tissue from lean, obese and obese subjects who were being treated for insulin resistance (Obese TD). (A–B) depicts analysis of CD11b+ and CD36+ expressing ATMs/g of adipose tissue demonstrating no difference between groups. (C) CD11c+ cells per gram of adipose were non-significantly increase in both obese and obese TD groups. (D) CD11c+ cells expressed as percent of total CD11b+ and (E) as percent of CD36+ ATM demonstrating an increase in both obese and obese TD groups (p<0.05, vs lean). (F) CD11c+CD206+ ATMs were significantly increased (p<0.05) in the obese TD group, which was also characterized by the highest indices of insulin resistance (see table 2). (G) Linear regression plot of CD11c+CD206+ content in lean and obese TD individuals against HOMA-IR values (N = 4/group; R2 = 0.59).
Figure 8
Figure 8. Human Obesity is Associated with Decreased Foxp3 Expression.
CD4+ T cells were non-significantly decreased in the greater omentum in obesity most probably due to an increase in CD8+ populations. Despite the decrease in total CD4+ cells there was a significant (p<0.05) increase in activated T effector cells (CD4+CD25low) as a percent of total CD3+ cells. (B) Foxp3 gene expression was significantly (P = 0.008, N = 6/group) decreased in the obese state suggesting a decrease in Tregs. (C) IL6 gene expression in the omentum was (p<0.05) significantly increased in the obese group. TH2 markers GATA3 and IL4R were decreased, while TH1 markers were unchanged with obesity.

References

    1. Kintscher U, Hartge M, Hess K, Foryst-Ludwig A, Clemenz M, et al. T-lymphocyte infiltration in visceral adipose tissue: a primary event in adipose tissue inflammation and the development of obesity-mediated insulin resistance. Arterioscler Thromb Vasc Biol. 2008;28:1304–1310. - PubMed
    1. Nishimura S, Manabe I, Nagasaki M, Eto K, Yamashita H, et al. CD8+ effector T cells contribute to macrophage recruitment and adipose tissue inflammation in obesity. Nat Med. 2009;15:914–920. - PubMed
    1. Winer S, Chan Y, Paltser G, Truong D, Tsui H, et al. Normalization of obesity-associated insulin resistance through immunotherapy. Nat Med. 2009;15:921–929. - PMC - PubMed
    1. Wu H, Ghosh S, Perrard XD, Feng L, Garcia GE, et al. T-cell accumulation and regulated on activation, normal T cell expressed and secreted upregulation in adipose tissue in obesity. Circulation. 2007;115:1029–1038. - PubMed
    1. Tadokoro CE, Shakhar G, Shen S, Ding Y, Lino AC, et al. Regulatory T cells inhibit stable contacts between CD4+ T cells and dendritic cells in vivo. J Exp Med. 2006;203:505–511. - PMC - PubMed

Publication types