. 2011 Mar;26(1):92-110.
doi: 10.1037/a0021483.

The structure of working memory abilities across the adult life span

Affiliations

The structure of working memory abilities across the adult life span

Sandra Hale et al. Psychol Aging. 2011 Mar.

Abstract

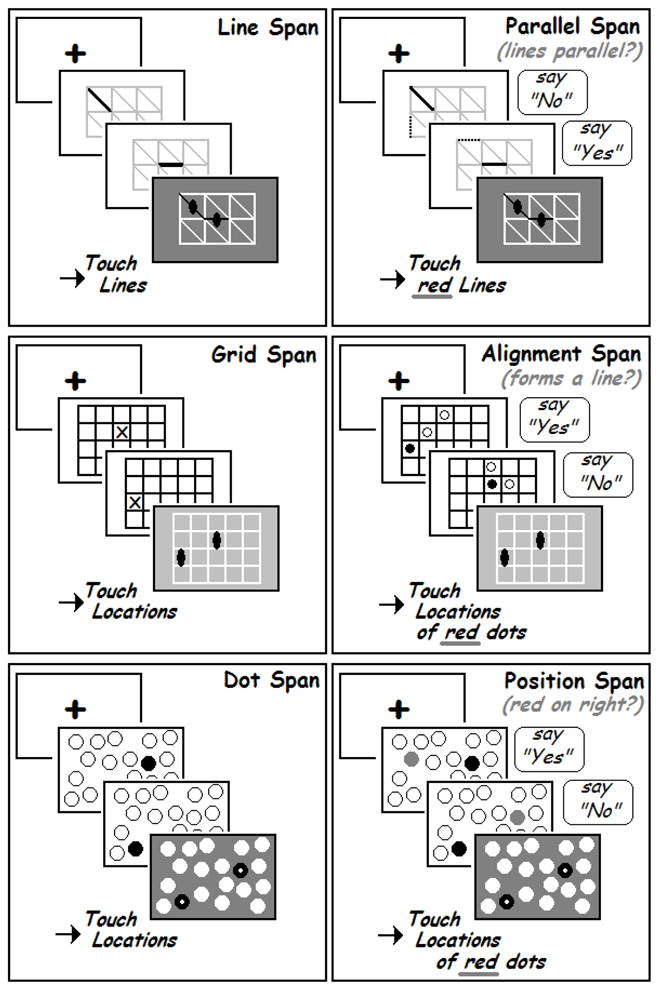
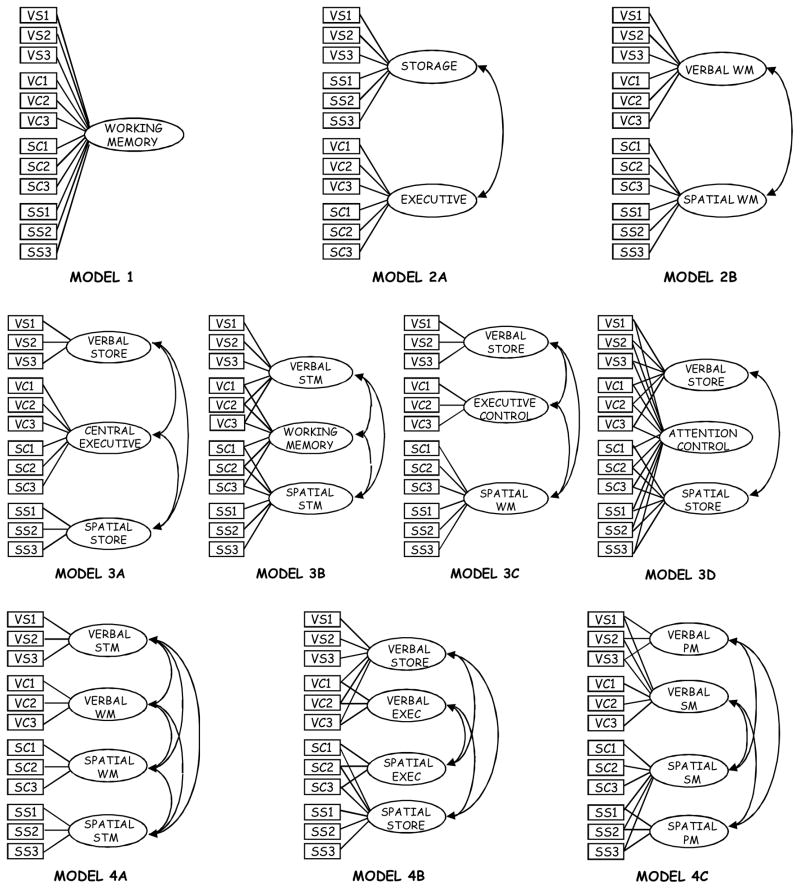
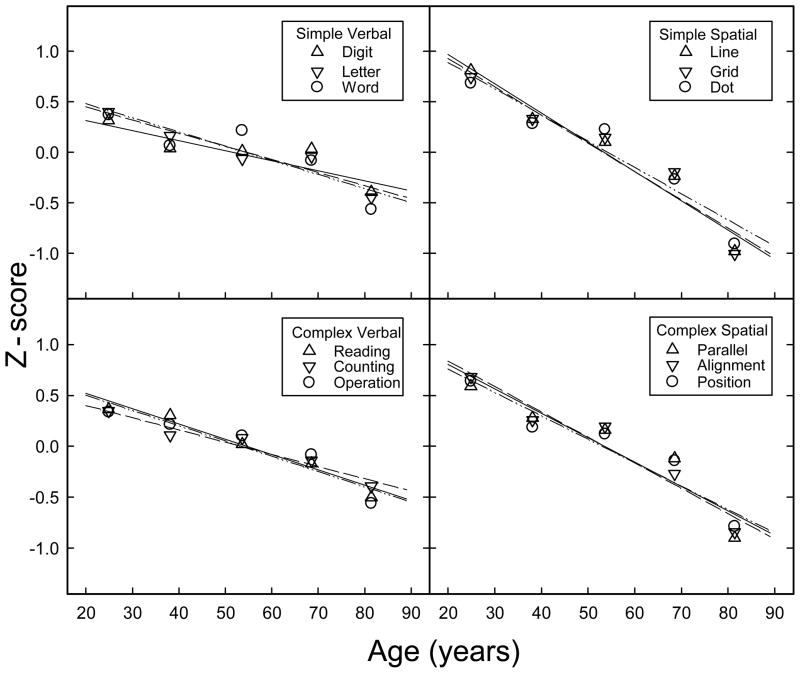
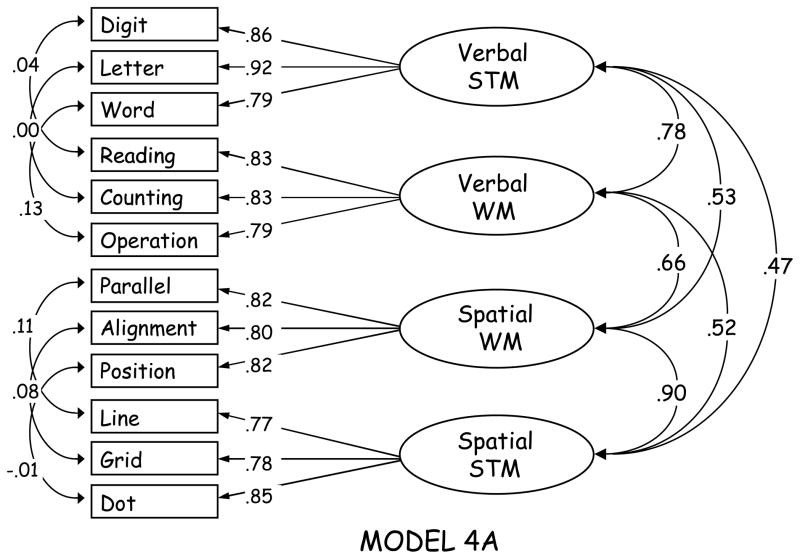
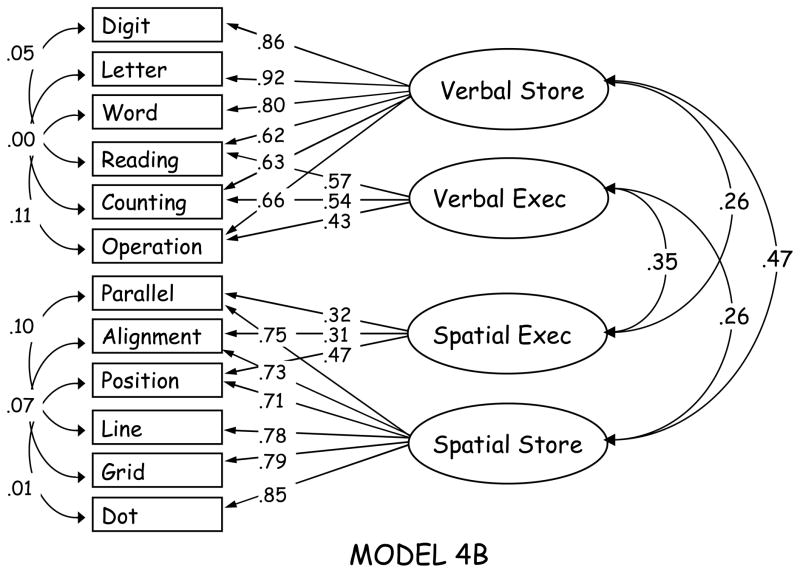
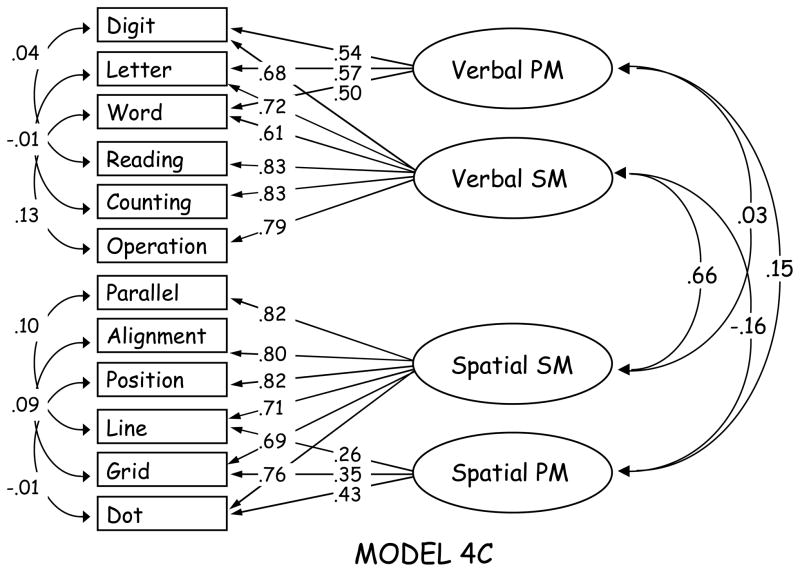
The present study addresses three questions regarding age differences in working memory: (1) whether performance on complex span tasks decreases as a function of age at a faster rate than performance on simple span tasks; (2) whether spatial working memory decreases at a faster rate than verbal working memory; and (3) whether the structure of working memory abilities is different for different age groups. Adults, ages 20-89 (n = 388), performed three simple and three complex verbal span tasks and three simple and three complex spatial memory tasks. Performance on the spatial tasks decreased at faster rates as a function of age than performance on the verbal tasks, but within each domain, performance on complex and simple span tasks decreased at the same rates. Confirmatory factor analyses revealed that domain-differentiated models yielded better fits than models involving domain-general constructs, providing further evidence of the need to distinguish verbal and spatial working memory abilities. Regardless of which domain-differentiated model was examined, and despite the faster rates of decrease in the spatial domain, age group comparisons revealed that the factor structure of working memory abilities was highly similar in younger and older adults and showed no evidence of age-related dedifferentiation.


Figures

Figure 1
Figure 1
Schematic representations of the six verbal span tasks. The three left panels show the simple working memory tasks requiring storage of digits, letters, and words. The three right panels show the corresponding complex working memory tasks requiring storage of digits, letters, and words, but also require processing irrelevant verbal information interleaved between the presentations of each primary memory item. The actual sentences in the Reading Span task were 7 to 10 words; simplified versions are shown here for purposes of illustration. Also note that the participant stated each memory item aloud as it appeared on the screen in both the simple and complex versions of the task.
Figure 2
Figure 2
Schematic representations of the six spatial span tasks. The three left panels show the simple working memory tasks requiring storage of the locations of lines, grid positions, and dot positions. The three right panels show the corresponding complex working memory tasks requiring storage of locations of lines, grid positions, and dot positions, but also require processing irrelevant visuospatial information presented simultaneously with the presentations of each primary memory item.
Figure 3
Figure 3
Schematic representations of the one-factor, two-factor, three-factor and four-factor models used to examine the structure of working memory. Arrows represent the correlations to be estimated between constructs. Note that the following abbreviations are used: VS1, VS2, and VS3 denote three Verbal Simple Span tasks; VC1, VC2, and VC3 denote three Verbal Complex Span tasks; SC1, SC2, and SC3 denote three Spatial Complex Span tasks; and, finally, SS1, SS2, and SS3 denote three Spatial Simple Span tasks. In addition, with the exception of Model 2a, these 12 tasks (i.e., the manifest variables) are depicted in the order given here. See text for additional details concerning the constructs (i.e., the latent variables).
Figure 4
Figure 4
Data from all of the individuals performing each of the six verbal span tasks were submitted to a linear regression analysis to determine the rate of decrease (if any) as a function of age across the seven decades of age represented in the current sample. The upper left panel displays the best-fitting linear functions for the three simple verbal span tasks (Digit Span, Letter Span, and Word Span). The lower left panel displays the best-fitting linear functions for the three complex verbal span tasks (Reading Span, Counting Span, and Operation Span). The upper right panel displays the best-fitting linear functions for the three simple spatial span tasks (Line Span, Grid Span, and Dot Span). The lower right panel displays the best-fitting linear functions for the three complex spatial span tasks (Parallel Span, Alignment Span, and Position Span). In addition to the linear functions shown in these four panels, the mean performance of seven age groups (binned as described in Table 3) are also shown (solid lines represent the first of each series in the order listed above, dashed lines represent the second of each series, and the dotted-dashed lines represent the third). Slope parameter values for all 12 functions are provided in Table 4.
Figure 5
Figure 5
A four-factor model of working memory previously fit by Park et al. (2002) is depicted here as Model 4a. Factor correlations, factor loadings, and correlated errors between each simple span task and its corresponding complex span task are provided. For the sake of clarity, error variances are not included in the model shown here. Fit statistics are provided in Table 9.
Figure 6
Figure 6
A four-factor model of working memory that is an extension of Conway’s three-factor model each with domain-specific storage and executive constructs is depicted here as Model 4b. Factor correlations, factor loadings, and correlated errors between each simple span task and its corresponding complex span task are provided. For the sake of clarity, error variances are not included in the model shown here. Fit statistics are provided in Table 9.
Figure 7
Figure 7
A four-factor model of working memory based on work by Unsworth and Engle (2007a) is depicted here as Model 4c. Factor correlations, factor loadings, and correlated errors between each simple span task and its corresponding complex span task are provided. For the sake of clarity, error variances are not included in the model shown here. Fit statistics are provided in Table 9.

References

    1. Ackerman PL, Beier ME, Boyle MO. Working memory and intelligence: The same or different constructs? Psychological Bulletin. 2005;131:30–60. - PubMed
    1. Akaike H. Information theory and an extension of the maximum likelihood principle. In: Petrov BN, Csaki F, editors. Second international symposium on information theory. Budapest: Academiai Kiado; 1973. pp. 267–281.
    1. Akaike H. Factor analysis and AIC. Psychometrika. 1987;52:317–332.
    1. Alloway TP, Gathercole SE, Pickering SJ. Verbal and visuospatial short-term and working memory in children: Are they separable? Child Development. 2006;77:1698–1716. - PubMed
    1. Arbuckle TY, Maag U, Pushkar D, Chaikelson JS. Individual differences in trajectory of intellectual development over 45 years of adulthood. Psychology and Aging. 1998;13:663–675. - PubMed

Publication types