. 2011 Apr;28(4):547-63.
doi: 10.1089/neu.2010.1729.

Concussive brain trauma in the mouse results in acute cognitive deficits and sustained impairment of axonal function

Affiliations

Concussive brain trauma in the mouse results in acute cognitive deficits and sustained impairment of axonal function

Jennifer A Creed et al. J Neurotrauma. 2011 Apr.

Abstract

Concussive brain injury (CBI) accounts for approximately 75% of all brain-injured people in the United States each year and is particularly prevalent in contact sports. Concussion is the mildest form of diffuse traumatic brain injury (TBI) and results in transient cognitive dysfunction, the neuropathologic basis for which is traumatic axonal injury (TAI). To evaluate the structural and functional changes associated with concussion-induced cognitive deficits, adult mice were subjected to an impact on the intact skull over the midline suture that resulted in a brief apneic period and loss of the righting reflex. Closed head injury also resulted in an increase in the wet weight:dry weight ratio in the cortex suggestive of edema in the first 24 h, and the appearance of Fluoro-Jade-B-labeled degenerating neurons in the cortex and dentate gyrus of the hippocampus within the first 3 days post-injury. Compared to sham-injured mice, brain-injured mice exhibited significant deficits in spatial acquisition and working memory as measured using the Morris water maze over the first 3 days (p<0.001), but not after the fourth day post-injury. At 1 and 3 days post-injury, intra-axonal accumulation of amyloid precursor protein in the corpus callosum and cingulum was accompanied by neurofilament dephosphorylation, impaired transport of Fluoro-Gold and synaptophysin, and deficits in axonal conductance. Importantly, deficits in retrograde transport and in action potential of myelinated axons continued to be observed until 14 days post-injury, at which time axonal degeneration was apparent. These data suggest that despite recovery from acute cognitive deficits, concussive brain trauma leads to axonal degeneration and a sustained perturbation of axonal function.


Figures

FIG. 1.
FIG. 1.
Model of concussive brain trauma. (A) The skull was exposed by reflecting the periosteum. (B) The hemispheric metal indentor tip was zeroed onto the surface of the skull, centered between the lambda and bregma sutures and over the sagittal suture. (C). Note the location of the minor fracture perpendicular to the sagittal suture typically observed immediately following impact.
FIG. 2.
FIG. 2.
Cognitive deficits following concussive brain trauma. Mice were tested for spatial learning (A and B), and working memory (C and D) abilities as described in the methods section. Repeated-measures analysis of analysis of variance (ANOVA) revealed an injury effect in both the spatial acquisition (A; p<0.025) and the working memory (C; p<0.025) paradigms on days 1–3 post-injury. No deficits were observed in spatial learning on days 4–6 post-injury (B), or in working memory on days 7–9 post-injury (D). All values are presented as mean±standard deviation.
FIG. 3.
FIG. 3.
Traumatic axonal injury following concussive brain trauma. Representative photomicrographs demonstrating intra-axonal immunoreactivity for β-amyloid precursor protein (β-APP, AC), synaptophysin (SYP, DF), and dephosphorylated neurofilament (SMI-32, GI), in the corpus callosum at 24 h (B, E, and H), and 3 days (C, F, and I) following impact. Note the absence of immunoreactivity for all three proteins in sham-injured brains (A, D, and G). β-APP-positive profiles were identified as swellings along contiguous axons (arrows in B), and terminal bulbs (arrowhead in C). SYP immunoreactivity was present as punctate staining (arrows in E), and larger swellings (arrowhead in F). SMI-32-positive profiles were apparent as swellings (arrows in H), and retraction balls (arrowheads in H and I). (J) Schematic diagram showing the spatial distribution of β-APP (gray circles), SYP (white circles), and SMI-32 (black circles), at 24 h (top panel), 3 days (middle panel), and 7 days (bottom panel) post-injury. (K) Quantification of the extent of intra-axonal β-APP immunoreactivity in white matter tracts below the site of impact. All values are presented as mean±standard deviation (*p<0.01, **p<0.001 compared to sham-injured brains; #p<0.001 compared to 3 or 7 days post-injury; scale bar=100 μm for panels A, D, and G, and 20 μm for all other panels).
FIG. 3.
FIG. 3.
Traumatic axonal injury following concussive brain trauma. Representative photomicrographs demonstrating intra-axonal immunoreactivity for β-amyloid precursor protein (β-APP, AC), synaptophysin (SYP, DF), and dephosphorylated neurofilament (SMI-32, GI), in the corpus callosum at 24 h (B, E, and H), and 3 days (C, F, and I) following impact. Note the absence of immunoreactivity for all three proteins in sham-injured brains (A, D, and G). β-APP-positive profiles were identified as swellings along contiguous axons (arrows in B), and terminal bulbs (arrowhead in C). SYP immunoreactivity was present as punctate staining (arrows in E), and larger swellings (arrowhead in F). SMI-32-positive profiles were apparent as swellings (arrows in H), and retraction balls (arrowheads in H and I). (J) Schematic diagram showing the spatial distribution of β-APP (gray circles), SYP (white circles), and SMI-32 (black circles), at 24 h (top panel), 3 days (middle panel), and 7 days (bottom panel) post-injury. (K) Quantification of the extent of intra-axonal β-APP immunoreactivity in white matter tracts below the site of impact. All values are presented as mean±standard deviation (*p<0.01, **p<0.001 compared to sham-injured brains; #p<0.001 compared to 3 or 7 days post-injury; scale bar=100 μm for panels A, D, and G, and 20 μm for all other panels).
FIG. 4.
FIG. 4.
Axonal degeneration following concussive brain trauma. Representative photomicrographs demonstrating Fluoro-Jade B–reactive axons in the corpus callosum at 14 days post-injury (C), but not in either sham-injured animals (A), or at 24 hs following injury (B). Note the appearance of swollen axonal segments (arrow in C), and terminal bulbs (arrowhead in C). Panels D (sham-injured) and E (7 days post-injury) are photomicrographs of Nissl-cyanine R staining in the corpus callosum. (F) Representative immunoblots of myelin basic protein from lysates of corpus callosum of sham-injured animals, and at 24 hours (Inj 24 h), 3 days (Inj 3 days), and 7 days (Inj 7 days) post-injury, demonstrating the characteristic 21.5- and 18.5-kDa bands. Quantification of optical density as a function of actin (loading control) is presented in the graph. All values are presented as mean±standard deviation (scale bar=20 μm for panels AC, and 50 μm for panels D and E).
FIG. 4.
FIG. 4.
Axonal degeneration following concussive brain trauma. Representative photomicrographs demonstrating Fluoro-Jade B–reactive axons in the corpus callosum at 14 days post-injury (C), but not in either sham-injured animals (A), or at 24 hs following injury (B). Note the appearance of swollen axonal segments (arrow in C), and terminal bulbs (arrowhead in C). Panels D (sham-injured) and E (7 days post-injury) are photomicrographs of Nissl-cyanine R staining in the corpus callosum. (F) Representative immunoblots of myelin basic protein from lysates of corpus callosum of sham-injured animals, and at 24 hours (Inj 24 h), 3 days (Inj 3 days), and 7 days (Inj 7 days) post-injury, demonstrating the characteristic 21.5- and 18.5-kDa bands. Quantification of optical density as a function of actin (loading control) is presented in the graph. All values are presented as mean±standard deviation (scale bar=20 μm for panels AC, and 50 μm for panels D and E).
FIG. 5.
FIG. 5.
Impaired retrograde transport following concussive brain trauma. Representative photomicrographs demonstrating Fluoro-Gold (FG)-labeled cell bodies in the cortex. (A) FG-positive cell bodies at the site of injection in sham-injured mice. (B) Note the absence of FG-labeled cell bodies in the cortex contralateral to the site of injection following transection of callosal fibers. (C) FG-positive cell bodies in the homotypic cortex contralateral to the site of injection in sham-injured mice. (D) At 14 days post-injury; note the particulate nature of FG (see also inset in C). (E) Quantification of FG-positive cells was performed as described in the methods section. All values are presented as mean±standard deviation (HPF, high-powered field; *p<0.05 compared to sham-injured animals; scale bar=100 μm for panels AD, and 10 μm for inset in panel C).
FIG. 5.
FIG. 5.
Impaired retrograde transport following concussive brain trauma. Representative photomicrographs demonstrating Fluoro-Gold (FG)-labeled cell bodies in the cortex. (A) FG-positive cell bodies at the site of injection in sham-injured mice. (B) Note the absence of FG-labeled cell bodies in the cortex contralateral to the site of injection following transection of callosal fibers. (C) FG-positive cell bodies in the homotypic cortex contralateral to the site of injection in sham-injured mice. (D) At 14 days post-injury; note the particulate nature of FG (see also inset in C). (E) Quantification of FG-positive cells was performed as described in the methods section. All values are presented as mean±standard deviation (HPF, high-powered field; *p<0.05 compared to sham-injured animals; scale bar=100 μm for panels AD, and 10 μm for inset in panel C).
FIG. 6.
FIG. 6.
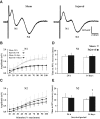
Inhibition of compound action potentials (CAPs) of myelinated fibers following concussive brain trauma. (A) Representative traces of evoked CAPs in sham- and brain-injured mice at 24 h post-injury. Evoked CAPs of (B) myelinated (N1) and (C) unmyelinated (N2) axons in the corpus callosum were measured as described in the methods section. Repeated-measures analysis of variance of CAP amplitude revealed an injury effect for the myelinated (p<0.001), but not the unmyelinated, component. Refractoriness for the (D) myelinated and (E) unmyelinated fibers at 24 h and 14 days post-injury (*p<0.04). All values are presented as mean±standard deviation.
FIG. 7.
FIG. 7.
Neurodegeneration in the cortex following concussive brain trauma. Representative photomicrographs illustrating Fluoro-Jade-B reactivity in the retrosplenial cortex in (A) sham-injured animals, and (B) at 24 h post-injury. (C) Quantification of the number of Fluoro-Jade-B-positive cells in the cortex below the site of impact. All values are presented as mean±standard deviation (*p<0.05, **p<0.001 compared to sham-injured brains; #p<0.001 compared to 3 or 7 days post-injury). Panels DF are photomicrographs of Nissl staining in the retrosplenial cortex of (D) sham-injured brains, and at (E) 24 h, and (F) 7 days post-injury. Note the increased cellularity in the brain-injured animals (scale bar=100 μm for all panels).
FIG. 7.
FIG. 7.
Neurodegeneration in the cortex following concussive brain trauma. Representative photomicrographs illustrating Fluoro-Jade-B reactivity in the retrosplenial cortex in (A) sham-injured animals, and (B) at 24 h post-injury. (C) Quantification of the number of Fluoro-Jade-B-positive cells in the cortex below the site of impact. All values are presented as mean±standard deviation (*p<0.05, **p<0.001 compared to sham-injured brains; #p<0.001 compared to 3 or 7 days post-injury). Panels DF are photomicrographs of Nissl staining in the retrosplenial cortex of (D) sham-injured brains, and at (E) 24 h, and (F) 7 days post-injury. Note the increased cellularity in the brain-injured animals (scale bar=100 μm for all panels).
FIG. 8.
FIG. 8.
Brain edema following concussive brain trauma. Tissue water content was measured in the cortex, hippocampus, and thalamus as described in the methods section. Factorial analysis of variance revealed that brain trauma significantly increased edema in the underlying cortex compared to sham-injured animals over the first 24 h post-surgery/injury. All values are presented as mean±standard deviation (*p<0.05 compared to sham-injured brains).
FIG. 9.
FIG. 9.
Neurodegeneration and synaptophysin immunoreactivity in the hippocampus following concussive brain trauma. Shown are representative photomicrographs of Nissl-stained sections, demonstrating a lack of change in the cellularity in the granule cell layers of the dentate gyrus at 24 h (A) and 7 days (B) post-injury. Fluoro-Jade-B-positive cells were present in the hilus of the dentate gyrus at 24 h (C), but not at 7 days (D) post-injury. (E) Quantification of Fluoro-Jade-B-positive cells was performed as described in the methods section. All values are presented as mean±standard deviation (*p<0.001 compared to sham animals; #p<0.01 compared to 3 or 7 days post-injury). Synaptophysin immunoreactivity was visualized as the classic trilaminar pattern of dark-light-dark staining in the molecular layer of the dentate gyrus in both sham-injured (F) and brain-injured animals at 24 h (G) and 14 days (H) post-injury (scale bar=100 μm for all panels).
FIG. 9.
FIG. 9.
Neurodegeneration and synaptophysin immunoreactivity in the hippocampus following concussive brain trauma. Shown are representative photomicrographs of Nissl-stained sections, demonstrating a lack of change in the cellularity in the granule cell layers of the dentate gyrus at 24 h (A) and 7 days (B) post-injury. Fluoro-Jade-B-positive cells were present in the hilus of the dentate gyrus at 24 h (C), but not at 7 days (D) post-injury. (E) Quantification of Fluoro-Jade-B-positive cells was performed as described in the methods section. All values are presented as mean±standard deviation (*p<0.001 compared to sham animals; #p<0.01 compared to 3 or 7 days post-injury). Synaptophysin immunoreactivity was visualized as the classic trilaminar pattern of dark-light-dark staining in the molecular layer of the dentate gyrus in both sham-injured (F) and brain-injured animals at 24 h (G) and 14 days (H) post-injury (scale bar=100 μm for all panels).

Similar articles

Cited by

References

    1. Arfanakis K. Haughton V.M. Carew J.D. Rogers B.P. Dempsey R.J. Meyerand M.E. Diffusion tensor MR imaging in diffuse axonal injury. AJNR Am. J. Neuroradiol. 2002;23:794–802. - PMC - PubMed
    1. Baker A.J. Phan N. Moulton R.J. Fehlings M.G. Yucel Y. Zhao M. Liu E. Tian G.F. Attenuation of the electrophysiological function of the corpus callosum after fluid percussion injury in the rat. J. Neurotrauma. 2002;19:587–599. - PubMed
    1. Bazarian J.J. McClung J. Shah M.N. Cheng Y.T. Flesher W. Kraus J. Mild traumatic brain injury in the United States, 1998–2000. Brain Inj. 2005;19:85–91. - PubMed
    1. Blumbergs P.C. Scott G. Manavis J. Wainwright H. Simpson D.A. McLean A.J. Staining of amyloid precursor protein to study axonal damage in mild head injury. Lancet. 1994;344:1055–1056. - PubMed
    1. Buki A. Povlishock J.T. All roads lead to disconnection?—Traumatic axonal injury revisited. Acta Neurochir. (Wien.) 2006;148:181–193. discussion 193–194. - PubMed

Publication types

MeSH terms