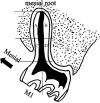
Three-dimensional morphology of root and alveolar trabecular bone during tooth movement using micro-computed tomography
- PMID: 21299390
- PMCID: PMC8923540
- DOI: 10.2319/071910-418.1
Three-dimensional morphology of root and alveolar trabecular bone during tooth movement using micro-computed tomography
Abstract
Objective: To investigate the effects of force magnitude on three-dimensional alveolar trabecular bone structure and root resorption.
Materials and methods: Twenty-two 11-week-old Sprague Dawley rats were randomly assigned to two groups that received a mesially directed orthodontic force to the upper right first molars at different magnitudes of force, 30 g or 100 g, for 2 weeks. The contralateral molars served as controls. The teeth and alveolar bone around the teeth were dissected from the sacrificed animals and were scanned with micro-computed tomography (CT). Structural properties of the trabecular bone and resorption crater volume on the mesial roots of the maxillary first molars were analyzed.
Results: The bone volume fraction of the 30 g group and the 100 g group increased significantly in both groups, and trabecular separation of the 100 g group decreased significantly compared with controls (P < .05). The total root resorption volume in all experimental groups and the resorption volume of the lower distal surface in the 100 g group increased significantly compared with controls (P < .01). The volume of the upper mesial root surface in the 30 g group increased significantly compared with the 100 g group and controls (P < .05).
Conclusion: The alveolar trabecular bone was denser after orthodontic force was applied for 14 days. The effects of 30 g and 100 g orthodontic forces on root resorption were different at the upper mesial and lower distal surfaces of the mesial roots of maxillary first molars.
Figures


References
-
- Guo X. E, Kim C. H. Mechanical consequence of trabecular bone loss and its treatment: a three-dimensional model simulation. Bone. 2002;30:404–411. - PubMed
-
- Ulrich D, van Rietbergen B, Laib A, Ruegsegger P. The ability of three-dimensional structural indices to reflect mechanical aspects of trabecular bone. Bone. 1999;25:55–60. - PubMed
-
- Verna C, Zaffe D, Siciliani G. Histomorphometric study of bone reactions during orthodontic tooth movement in rats. Bone. 1999;24:371–379. - PubMed
-
- Hsu J. T, Chang H. W, Huang H. L, Yu J. H, Li Y. F, Tu M. G. Bone density changes around teeth during orthodontic treatment. Clin Oral Investig. 2010 Apr 15 [Epub ahead of print] - PubMed
-
- Milne T. J, Ichim I, Patel B, McNaughton A, Meikle M. C. Induction of osteopenia during experimental tooth movement in the rat: alveolar bone remodeling and the mechanostat theory. Eur J Orthod. 2009;31:221–231. - PubMed
Publication types
MeSH terms
LinkOut - more resources
Full Text Sources

