

A comprehensive understanding of thioTEPA metabolism in the mouse using UPLC-ESI-QTOFMS-based metabolomics
- PMID: 21300029
- PMCID: PMC6309239
- DOI: 10.1016/j.bcp.2011.01.024
A comprehensive understanding of thioTEPA metabolism in the mouse using UPLC-ESI-QTOFMS-based metabolomics
Abstract
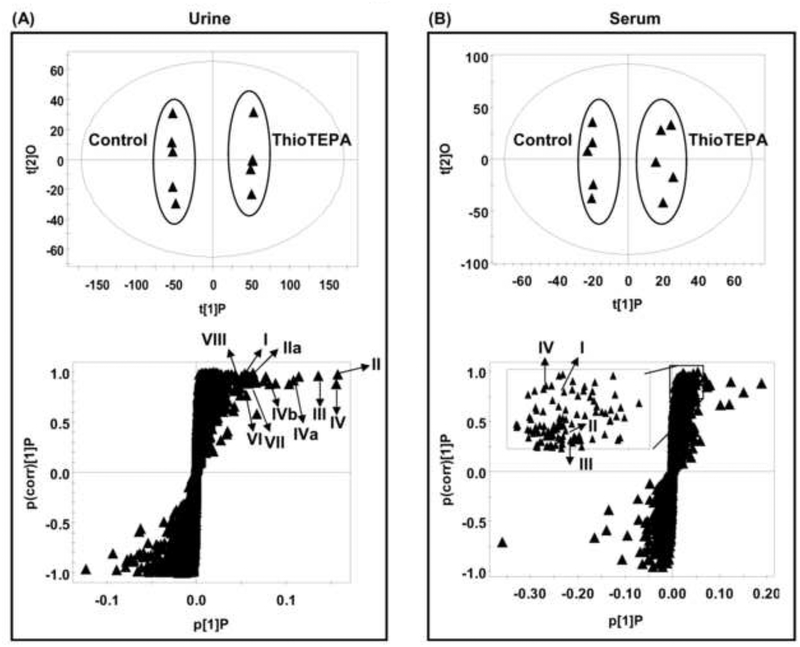
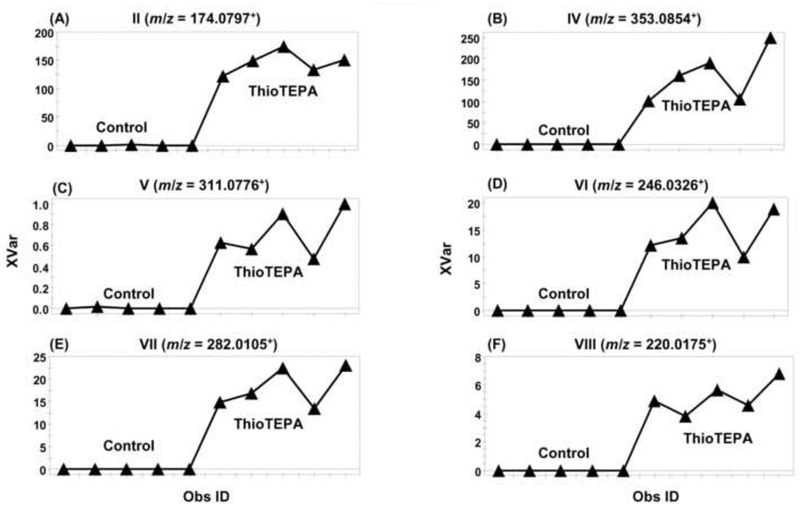
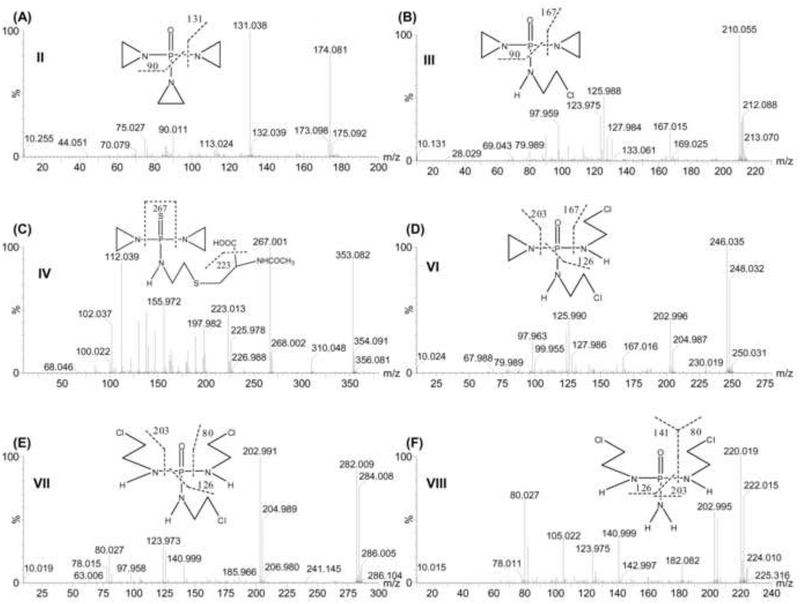
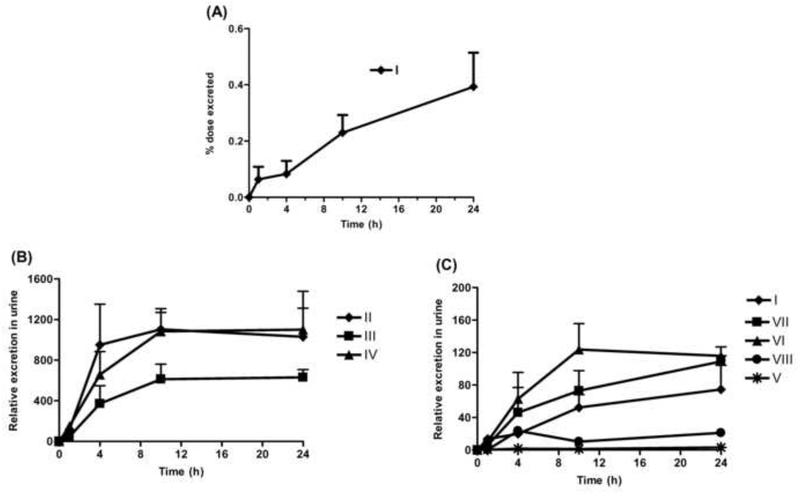
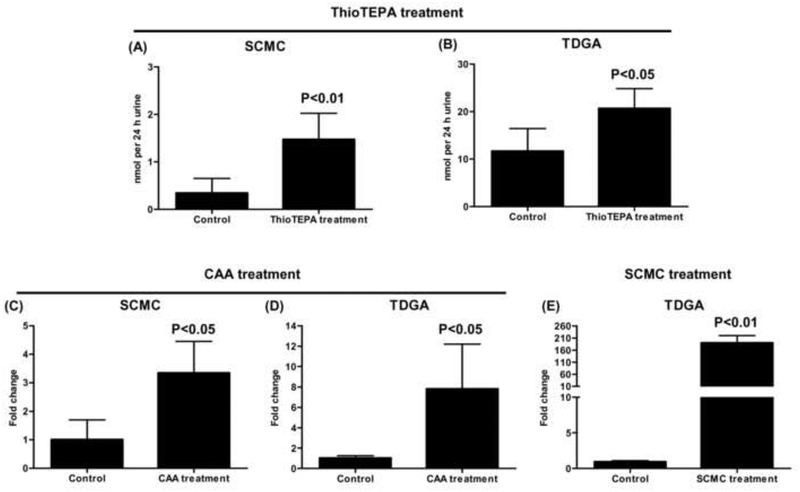
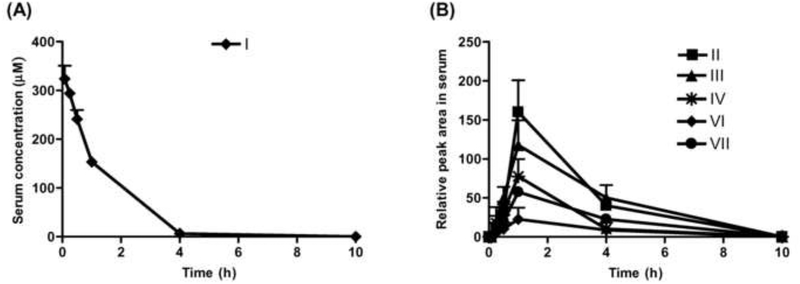
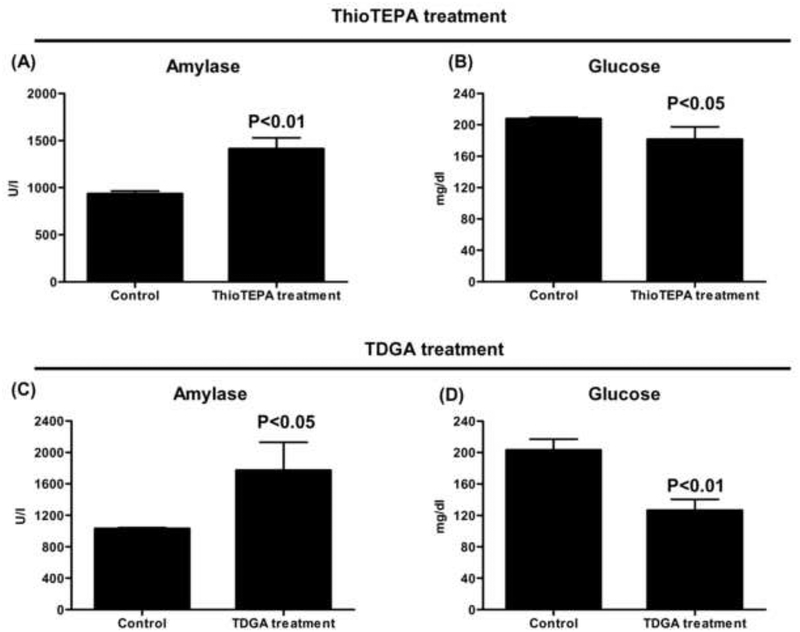
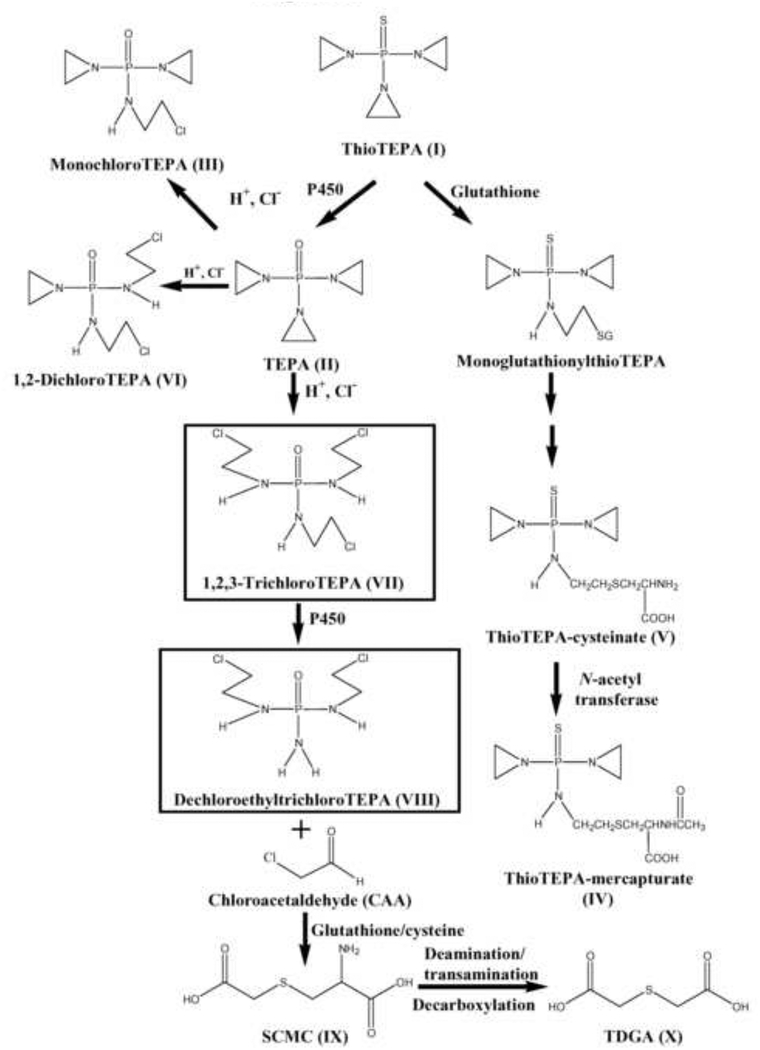
ThioTEPA, an alkylating agent with anti-tumor activity, has been used as an effective anticancer drug since the 1950s. However, a complete understanding of how its alkylating activity relates to clinical efficacy has not been achieved, the total urinary excretion of thioTEPA and its metabolites is not resolved, and the mechanism of formation of the potentially toxic metabolites S-carboxymethylcysteine (SCMC) and thiodiglycolic acid (TDGA) remains unclear. In this study, the metabolism of thioTEPA in a mouse model was comprehensively investigated using ultra-performance liquid chromatography coupled with electrospray ionization quadrupole time-of-flight mass spectrometry (UPLC-ESI-QTOFMS) based-metabolomics. The nine metabolites identified in mouse urine suggest that thioTEPA underwent ring-opening, N-dechloroethylation, and conjugation reactions in vivo. SCMC and TDGA, two downstream thioTEPA metabolites, were produced from thioTEPA from two novel metabolites 1,2,3-trichloroTEPA (VII) and dechloroethyltrichloroTEPA (VIII). SCMC and TDGA excretion were increased about 4-fold and 2-fold, respectively, in urine following the thioTEPA treatment. The main mouse metabolites of thioTEPA in vivo were TEPA (II), monochloroTEPA (III) and thioTEPA-mercapturate (IV). In addition, five thioTEPA metabolites were detected in serum and all shared similar disposition. Although thioTEPA has a unique chemical structure which is not maintained in the majority of its metabolites, metabolomic analysis of its biotransformation greatly contributed to the investigation of thioTEPA metabolism in vivo, and provides useful information to understand comprehensively the pharmacological activity and potential toxicity of thioTEPA in the clinic.
Copyright © 2011 Elsevier Inc. All rights reserved.
Figures
Similar articles
-
Stability of thioTEPA and its metabolites, TEPA, monochloroTEPA and thioTEPA-mercapturate, in plasma and urine.Int J Pharm. 2000 May 10;200(2):187-94. doi: 10.1016/s0378-5173(00)00370-7. Int J Pharm. 2000. PMID: 10867248
-
Comparative metabolism of cyclophosphamide and ifosfamide in the mouse using UPLC-ESI-QTOFMS-based metabolomics.Biochem Pharmacol. 2010 Oct 1;80(7):1063-74. doi: 10.1016/j.bcp.2010.06.002. Epub 2010 Jun 10. Biochem Pharmacol. 2010. PMID: 20541539 Free PMC article.
-
Urinary excretion of thioTEPA and its metabolites in patients treated with high-dose cyclophosphamide, thioTEPA and carboplatin.Anticancer Drugs. 2001 Jul;12(6):519-24. doi: 10.1097/00001813-200107000-00005. Anticancer Drugs. 2001. PMID: 11459998
-
Identification of thiodiglycolic acid, thiodiglycolic acid sulfoxide, and (3-carboxymethylthio)lactic acid as major human biotransformation products of S-carboxymethyl-L-cysteine.Drug Metab Dispos. 1991 Jan-Feb;19(1):222-6. Drug Metab Dispos. 1991. PMID: 1673403
-
Chemistry, pharmacology and pharmacokinetics of N,N',N" -triethylenethiophosphoramide (ThioTEPA).Cancer Treat Rev. 2000 Aug;26(4):257-68. doi: 10.1053/ctrv.2000.0170. Cancer Treat Rev. 2000. PMID: 10913381 Review.
Cited by
-
Metabolic map and bioactivation of the anti-tumour drug noscapine.Br J Pharmacol. 2012 Nov;167(6):1271-86. doi: 10.1111/j.1476-5381.2012.02067.x. Br J Pharmacol. 2012. PMID: 22671862 Free PMC article.
-
Stable isotope- and mass spectrometry-based metabolomics as tools in drug metabolism: a study expanding tempol pharmacology.J Proteome Res. 2013 Mar 1;12(3):1369-76. doi: 10.1021/pr301023x. Epub 2013 Jan 31. J Proteome Res. 2013. PMID: 23301521 Free PMC article.
-
Xenobiotic metabolomics: major impact on the metabolome.Annu Rev Pharmacol Toxicol. 2012;52:37-56. doi: 10.1146/annurev-pharmtox-010611-134748. Epub 2011 Aug 3. Annu Rev Pharmacol Toxicol. 2012. PMID: 21819238 Free PMC article. Review.
-
Metabolomics reveals the metabolic map of procainamide in humans and mice.Biochem Pharmacol. 2012 May 15;83(10):1435-44. doi: 10.1016/j.bcp.2012.02.013. Epub 2012 Feb 24. Biochem Pharmacol. 2012. PMID: 22387617 Free PMC article.
-
Celastrol ameliorates acute liver injury through modulation of PPARα.Biochem Pharmacol. 2020 Aug;178:114058. doi: 10.1016/j.bcp.2020.114058. Epub 2020 May 26. Biochem Pharmacol. 2020. PMID: 32470546 Free PMC article.
References
-
- Andrievsky GV, Sukhodub LF, Pyatigorskaya TL, Boryak OA, Limanskaya O, Shelkovsky VS. Direct observation of the alkylation products of deoxyguanosine and DNA by fast atom bombardment mass spectrometry. Biol Mass Spectrom 1991;20:665–8. - PubMed
-
- Musser SM, Pan SS, Callery PS. Liquid chromatography-thermospray mass spectrometry of DNA adducts formed with mitomycin C, porfiromycin and thiotepa. J Chromatogr 1989;474:197–207. - PubMed
-
- Teicher BA, Holden SA, Cucchi CA, Cathcart KN, Korbut TT, Flatow JL, et al. Combination of N,N’,N”-triethylenethiophosphoramide and cyclophosphamide in vitro and in vivo. Cancer Res 1988;48:94–100. - PubMed
Publication types
MeSH terms
Substances
Grants and funding
LinkOut - more resources
Full Text Sources
