. 2011 Feb 9;19(2):244-56.
doi: 10.1016/j.str.2010.11.016.

The extracellular architecture of adherens junctions revealed by crystal structures of type I cadherins

Affiliations

The extracellular architecture of adherens junctions revealed by crystal structures of type I cadherins

Oliver J Harrison et al. Structure. .

Abstract

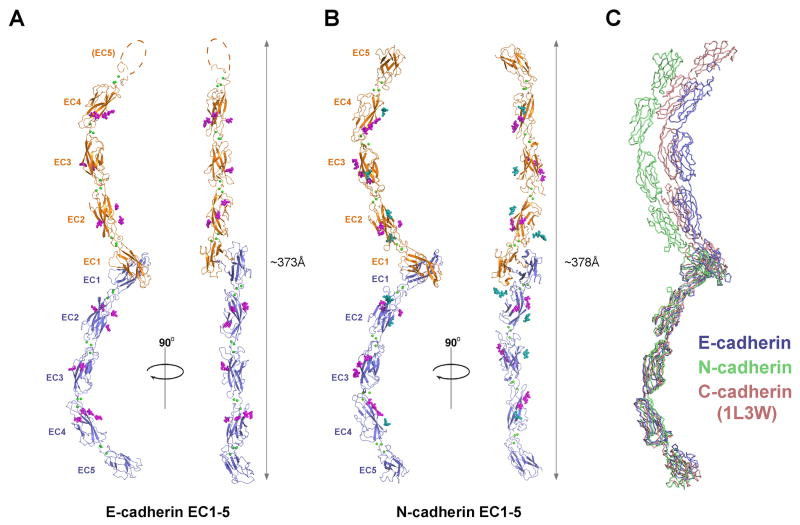
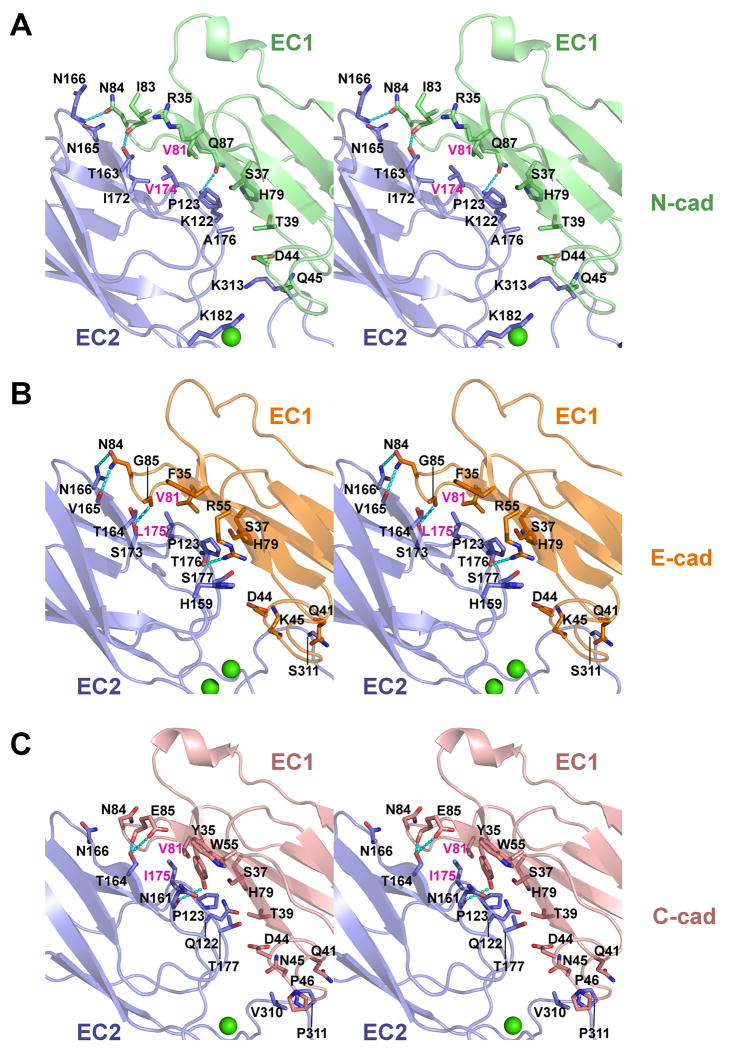
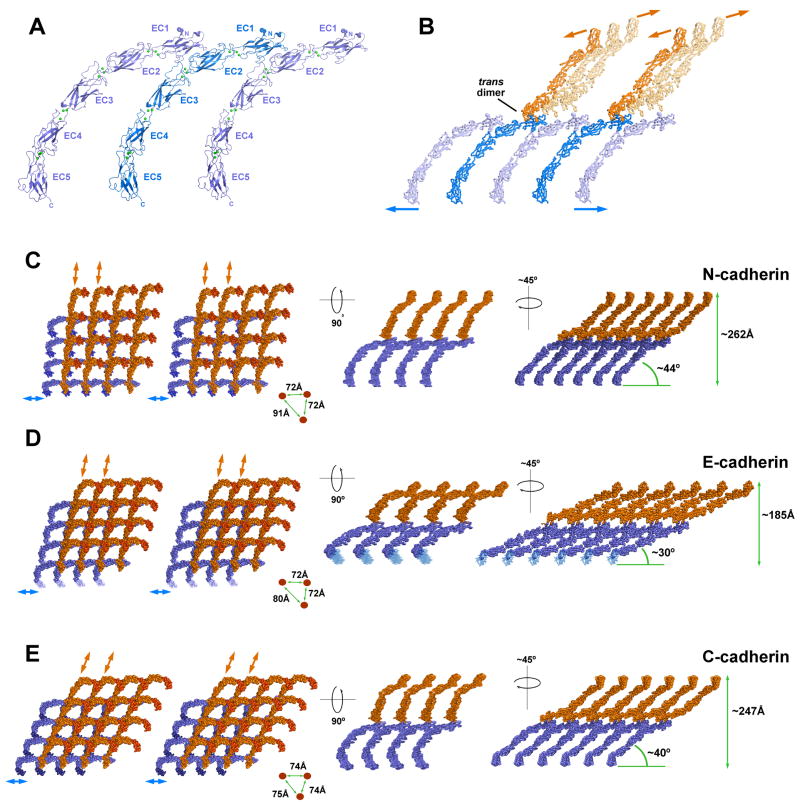
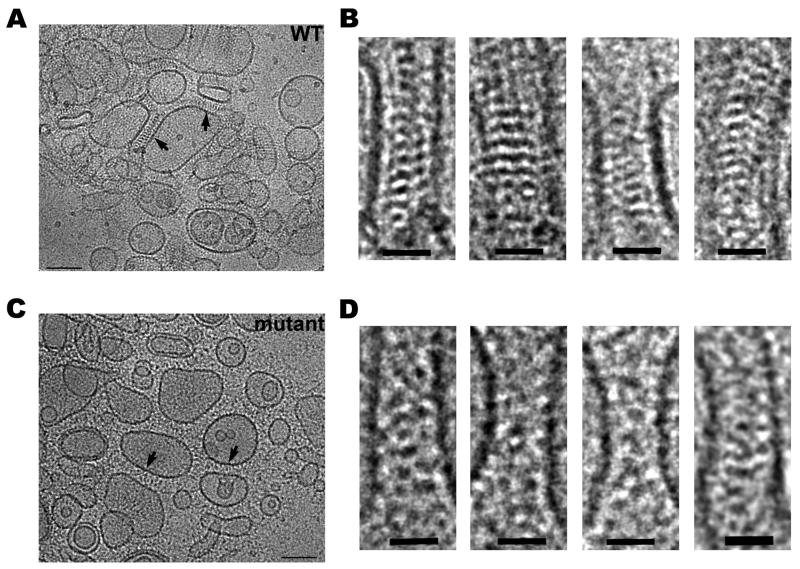
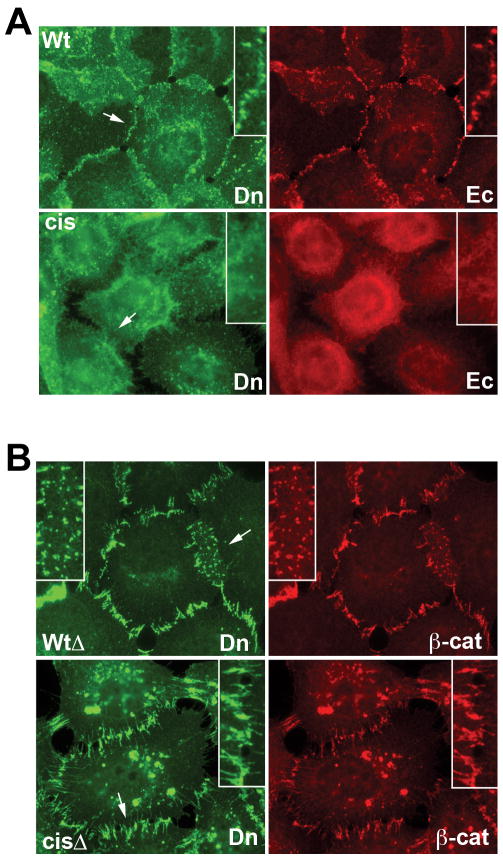
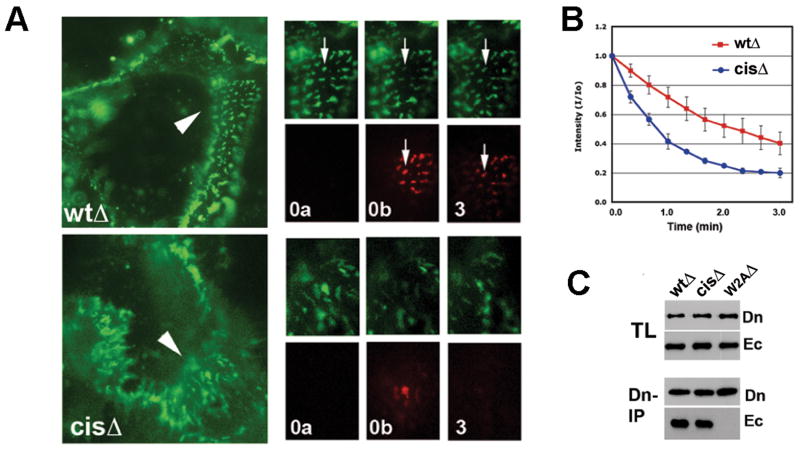
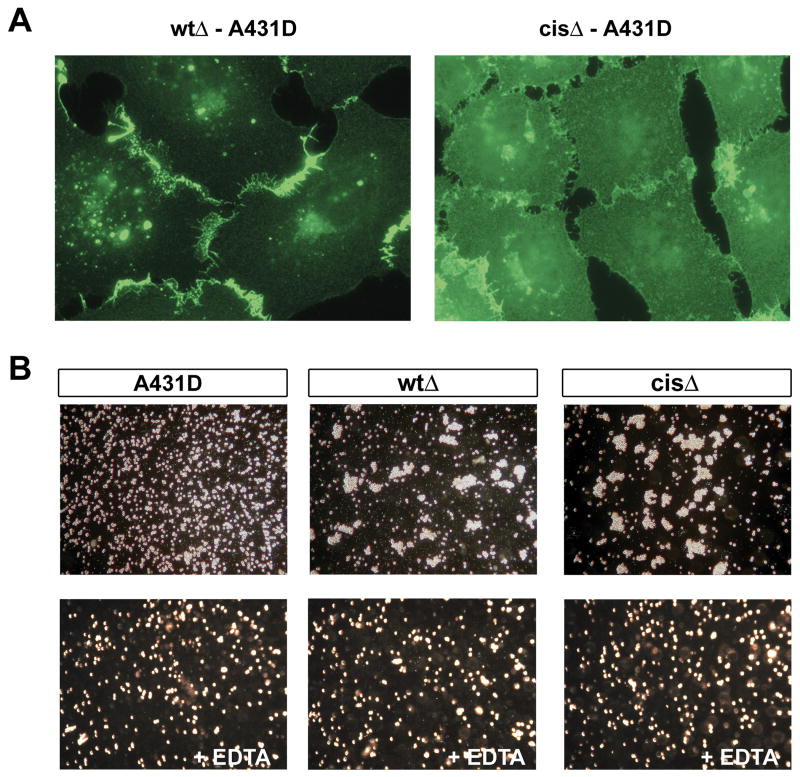
Adherens junctions, which play a central role in intercellular adhesion, comprise clusters of type I classical cadherins that bind via extracellular domains extended from opposing cell surfaces. We show that a molecular layer seen in crystal structures of E- and N-cadherin ectodomains reported here and in a previous C-cadherin structure corresponds to the extracellular architecture of adherens junctions. In all three ectodomain crystals, cadherins dimerize through a trans adhesive interface and are connected by a second, cis, interface. Assemblies formed by E-cadherin ectodomains coated on liposomes also appear to adopt this structure. Fluorescent imaging of junctions formed from wild-type and mutant E-cadherins in cultured cells confirm conclusions derived from structural evidence. Mutations that interfere with the trans interface ablate adhesion, whereas cis interface mutations disrupt stable junction formation. Our observations are consistent with a model for junction assembly involving strong trans and weak cis interactions localized in the ectodomain.


Figures

Figure 1
Figure 1. Ectodomain structures of mouse E- and N-cadherin
(A) E-cadherin crystal structure showing a strand swapped trans dimer (ribbon view). Protomers are colored blue and orange; calcium ions bound in the interdomain linker regions are shown as green spheres. Strand swapped dimerization occurs between EC1 domains and is anchored by exchange of Trp2 residues (sticks). O-linked glycosylation observed in the structure is shown as magenta spheres. The EC5 domain of one protomer was not resolved and is represented by a dotted line. (B) N-cadherin strand swapped dimer crystal structure, shown in the same representation as for E-cadherin in panel A. N-linked glycosylation is shown as blue spheres. (C) Strand swapped trans dimer structures of E-, N- and C-cadherin (1L3W) superposed over a single protomer, to compare dimer angles. A closer comparison of the curvature of single ectodomains of E-, N- and C-cadherin is shown in Supp. Fig. 1B. See also Supp. Fig. 1 and Table 1.
Figure 2
Figure 2. A conserved cis interface in E-, N- and C-cadherin
Stereo views of cis interfaces observed in crystal structures of (A) mouse N-cadherin, (B) mouse E-cadherin and (C) Xenopus C-cadherin (1L3W) are shown in ribbon representation. Interfaces are formed between a concave surface of EC1 (colored green, orange and salmon for E-, N- and C-cadherin) and a convex surface of EC2 of a partner molecule oriented in parallel (blue). Regions of EC3 involved in contacts are also shown. Side chains of residues contributing at least 10Å2 buried surface area to the interface are displayed as sticks. Hydrogen bonds are shown as dashed lines, calcium ions are shown as green spheres. Residues selected for mutation (see text) are labeled in magenta. See also Supp. Fig. 2 and Supp. Table 1.
Figure 3
Figure 3. A molecular layer formed by cis and trans interactions in crystal lattices of E-, N- and C-cadherin
(A) Linear array formed by cis interactions between parallel ectodomains of N-cadherin. Identical interactions are observed in the crystal lattices of E-, and C-cadherin (1L3W). (B) One cis array (blue) engaged in strand swapped trans interactions with two cis arrays (orange) that are oriented as if emanating from an opposing cell. Arrows indicate directions in which linear rows of cis dimers would extend. Note the almost perpendicular angle between the opposing linear arrays. For clarity, only two trans interactions are shown (bolder shading). N-cadherin is depicted; similar interactions are observed in E-cadherin and C-cadherin. (C, D, E) Left panels show stereo views of segments of the molecular layer formed by cis and trans interactions in the crystal lattices of N-, E-and C-cadherin (1L3W), viewed perpendicular to the plane of the layer and oriented with blue cis arrays horizontal. Lattice segments comprising 4×4 trans dimers are shown; EC5 domains are shaded to aid orientation. Right panels show two projections of the molecular layer viewed along the proposed plane of the membranes. Distances between C-termini in right panels determined from crystal lattice dimensions (N-, C-cadherin) or from measurement in Pymol (E-cadherin).
Figure 4
Figure 4. Electron microscopy of artificial junctions between E-cadherin coated liposomes
(A) Cryo-electron microscopy of liposomes coated with wild-type mouse E-cadherin EC1-5 after 40 minutes of aggregation. Arrows indicate junction-like structures formed between apposed membranes. (B) Close-up views of selected junctions between wild-type E-cadherin coated liposomes. Note the ordered arrangement of electron-dense material in the intermembrane space. (C) Aggregated liposomes coated with the cis interface mutant V81D L175D of mouse E-cadherin EC1-5. Junction-like regions are indicated by arrows as in A. (D) Close up views of the mutant junctions. Note the absence of highly ordered intermembrane density compared to wild-type. Scale bars 100nm (A, C) and 30nm (B, D). See also Supp. Fig. 4 and Supp. Table 2.
Figure 5
Figure 5. Effects of cis-mutations on subcellular distribution of full-length and catenin-uncoupled E-cadherin in A-431 cells
(A) A-431 cells expressing full-length Dendra2-tagged human E-cadherin (Wt) or its V81D V175D cis mutant (Cis) were double-stained using rabbit anti-Dendra2 antibody against the recombinant cadherins (Dn, green) and mAB C20820 against endogenous cadherin (Ec, red). Magnifications of selected regions (arrows) are inset. Note the dominant negative phenotype of the cis mutant. (B) A-431 cells expressing catenin-uncoupled E-cadherin-Dendra (WtΔ) or its V81D V175D cis-mutant (CisΔ) stained with anti-Dendra2 (Dn, green) and anti-β-catenin to mark endogenous cadherins (β-cat, red). Recombinant and endogenous cadherins co-cluster at junctions in both cell lines. See also Supp. Fig. 3.
Figure 6
Figure 6. Cis mutations destabilize cadherin junctions in A-431 cells
(A) Time-lapse analysis of photoactivated junctions in A-431 cells expressing fluorescent Ecadwt Δ-Dendra (WtΔ) or its V81D V175D cis interface mutant EcadcisΔ -Dendra (cisΔ). Left are low magnification images of initial frames; sequences are shown on the right (see movies S3 and S4). A 5 μm region of cell-cell contact (arrowhead) was photoactivated and cells were imaged in green (normal Dendra2 fluorescence) and red (photoconverted Dendra2) channels. ‘0a’: before photoactivation; ‘0b’ immediately after activation; ‘3’: after 3 minutes. Arrows in each sequence indicate the same cadherin cluster. (B) Changes in intensity of red fluorescence in individual junctions after Dendra2 activation, averaged from four independent experiments (n = 30). Initial red fluorescence is considered to be 1.0. Error bars represent SD (n = 20). (C) Co-immunoprecipitation assay with A-431 cells expressing EcadwtΔ-Dendra (WtΔ), cis mutant EcadcisΔ-Dendra (CisΔ) or trans dimer mutant (W2AΔ). Total lysates (TL) and anti-Dendra immunoprecipitates (Dn-IP) were probed with anti-Dendra (Dn) and for co-immunoprecipitated endogenous cadherin by anti-E-cadherin C20820 (Ec). See also Supp. Fig. 5 and Supp. Movies S1-S4.
Figure 7
Figure 7. Subcellular distribution of E-cadherin cis mutants in A-431D cells
(A) Dendra fluorescence of A-431D cells expressing equal wild-type EcadwtΔ-Dendra or cis mutant V81D V175D (EcadcisΔ-Dendra). (B) Short term aggregation assays with the two cell lines. Images show cells after 30 minutes of shaking aggregation in 3mM calcium (upper panels) or 3mM EDTA (lower panels). Parental A-431D cells show no aggregation (A-431D). See also Supp. Fig. 6 for results with full-length versions of the above constructs.

References

    1. Al-Amoudi A, Diez DC, Betts MJ, Frangakis AS. The molecular architecture of cadherins in native epidermal desmosomes. Nature. 2007;450:832–837. - PubMed
    1. Arac D, Boucard AA, Ozkan E, Strop P, Newell E, Sudhof TC, Brunger AT. Structures of neuroligin-1 and the neuroligin-1/neurexin-1 beta complex reveal specific protein-protein and protein-Ca2+ interactions. Neuron. 2007;56:992–1003. - PubMed
    1. Aricescu AR, Jones EY. Immunoglobulin superfamily cell adhesion molecules: zippers and signals. Curr Opin Cell Biol. 2007;19:543–550. - PubMed
    1. Boggon TJ, Murray J, Chappuis-Flament S, Wong E, Gumbiner BM, Shapiro L. C-cadherin ectodomain structure and implications for cell adhesion mechanisms. Science. 2002;296:1308–1313. - PubMed
    1. Chen C, Posy S, Ben-Shaul A, Shapiro L, Honig B. Specificity of cell-cell adhesion by classical cadherins: Critical role for low-affinity dimerization through beta-strand swapping. Proc Natl Acad Sci U S A. 2005;102:8531–8536. - PMC - PubMed

Publication types

MeSH terms