. 2011 Apr 1;589(Pt 7):1681-9.
doi: 10.1113/jphysiol.2010.198531. Epub 2011 Feb 7.

Altered electroretinograms in patients with KCNJ10 mutations and EAST syndrome

Affiliations

Altered electroretinograms in patients with KCNJ10 mutations and EAST syndrome

Dorothy A Thompson et al. J Physiol. .

Abstract

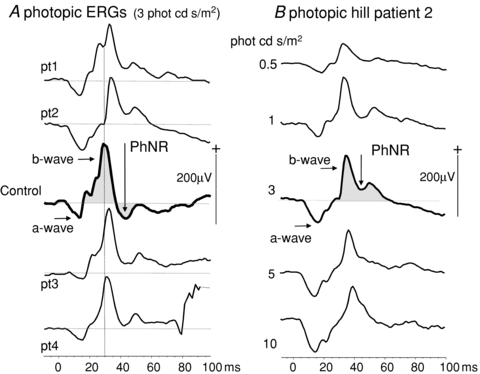
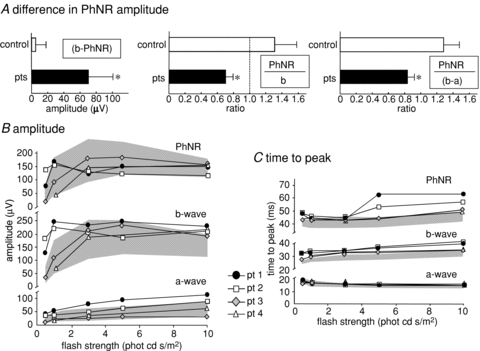
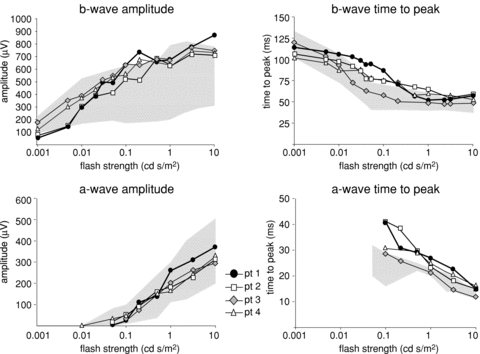
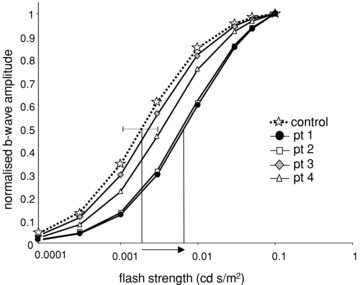
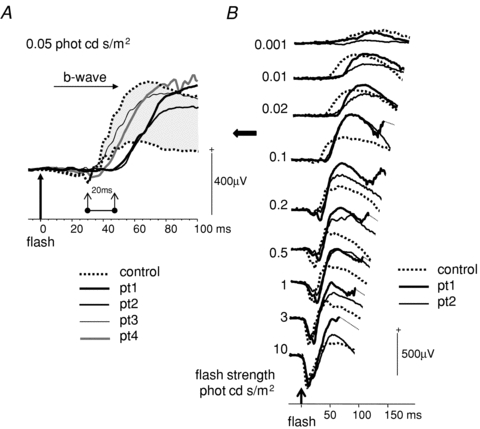
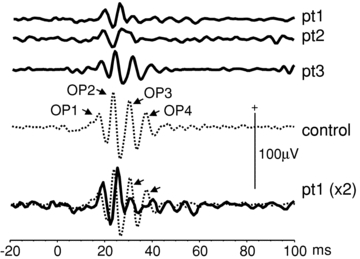
The K+ channel expressed by the KCNJ10 gene (Kir4.1) has previously demonstrated importance in retinal function in animal experiments. Recently, mutations in KCNJ10 were recognised as pathogenic in man, causing a constellation of symptoms, including epilepsy, ataxia, sensorineural deafness and a renal tubulopathy designated as EAST syndrome. We have studied the impact of KCNJ10 mutations on the human electroretinogram (ERG) in four unrelated patients with EAST syndrome. Corneal ganzfeld ERGs were elicited in response to flash stimuli of strengths of 0.001–10 phot cd s/m2 presented scotopically, and 0.3–10 phot cd s/m2 presented photopically. ERG waveforms from light-adapted retinae of all patients showed reduced amplitudes of the photopic negative response (PhNR) (P < 0.001). The photopic ERGs showed a delay in b-wave time to peak, but the photopic hill, i.e. the relative variation of time to peak and amplitude with luminance flash strength, was preserved. Scotopic ERGs to flash strengths 0.01 to 0.1 phot cd s/m2 showed a delay of up to 20 ms before the onset of the b-wave in two patients compared to controls. Stimulus–response functions were fitted by Michaelis–Menten equations and showed significantly lower retinal sensitivity in two patients than in controls (P < 0.001). Our study for the first time in the human ERG shows changes in association with KCNJ10 mutations affecting a Muller cell K+ channel. These data illustrate the role of KCNJ10 function in the physiology of proximal and possibly also the distal human retina.


Figures

Figure 1
Figure 1. Retinal nerve fibre layer (RNFL) thickness
RNFL thickness (continuous black line) is plotted against axial-scan location on horizontal axis (256 a-scans through 360 deg). The grey region indicates 5–95th centile of normal peri-papillary thickness. Temporal (temp), superior (sup), nasal (nas) and inferior (inf) quadrants are indicated below the graph. ONH, optic nerve head; RPE, retinal pigment epithelium. The scan was acquired with Zeiss Stratus OCT3.
Figure 2
Figure 2. Photopic ERGs
A, photopic ERGs to flashes of time-integrated luminance of 3 phot cd s/m2 are shown for all patients (pt1–4) with a control ERG of median amplitude for comparison (centre trace). The arrows and shaded areas show the difference in PhNR of patients and control; the control PhNR falls below the baseline. The dotted vertical reference line highlights the longer time to peak of all photopic b-waves compared to control data. B, a photopic luminance response series from patient 2 shows waveform and time to peak changes of the ‘photopic hill’. Arrows indicate the a-wave, b-wave and PhNR. The PhNR does not descend below the dotted baseline.
Figure 3
Figure 3. Photopic ERG amplitude and time to peak data
A, the patient mean difference in amplitude between the b-wave and PhNR for flash strength of 3 phot cd s/m2 is graphically presented with the control group (*P < 0.02). The patient mean ratio measure of PhNR amplitude:b-wave amplitude and PhNR amplitude:b-wave minus a-wave baseline amplitude are graphically presented with control data (*P < 0.001). The error bars represent +1 SD. Values less than the dotted reference line at ratio 1 occur if PhNR is smaller than the b-wave or does not reach the baseline. B, luminance response profiles are shown for amplitudes of PhNR, a-wave and b-wave compared with normal range shaded in grey. The PhNR amplitudes of the patients are smaller than the b-wave. C, luminance response profiles are shown for time to peaks for PhNR, a-wave and b-wave. The shaded area indicates normal range. Time to peak of b-wave and PhNR fall outside the upper limit of normal.
Figure 4
Figure 4. Scotopic ERG a-wave and b-wave amplitudes and time to peak data
Scotopic luminance response series show the growth of b-wave amplitude from 5th to 95th centile; a-wave amplitudes were normal. The a- and b-wave times to peak showed delays outside the 95th centile. The shaded area of each graph indicates normal range.
Figure 5
Figure 5. Michaelis–Menten luminance response functions
Michaelis–Menten functions were fitted to scotopic b-wave amplitudes from the 1st limb of the luminance response curve, i.e. flash time-integrated luminances ≤0.1 cd s/m2, for each patient. Normalised control data are shown by star symbols linked by dotted line, patients shown by solid lines. Vertical lines indicate the difference in flash luminance needed to elicit half-maximum response in a patient with p.R65P mutation and control. The dotted line shows ± 2 SD control mean of LogK. Mean control data: Vmax, 372 μV; n, 0.996; LogK, 0.002; SD 0.00078. Patient data: LogK pt1, 0.008; pt2, 0.007; pt3, 0.004; pt4, 0.003.
Figure 6
Figure 6. Delay of scotopic b-wave onset
A, scotopic ERGs to 0.05 cd s/m2 time integrated flash luminance for all patients are shown with control data outlining the 5th and 95th centile shaded grey. The 20 ms delay in the onset of the b-wave in patients 1 and 2, compared to controls, is highlighted. B, scotopic ERGs from patients 1 and 2 to a range of flash strengths around the maximal onset delay are shown.
Figure 7
Figure 7. Oscillatory potentials (OPs)
Scotopic OPs are shown from patients 1, 2 and 3. OPs could not be carried out in patient 4 due to poor compliance. The bottom traces show pt 1 data scaled ×2 and overlaid (black) on a control example of mean data (dotted). This highlights the reduction of later OPs.

References

    1. Bockenhauer D, Feather S, Stanescu HC, Bandulik S, Zdebik AA, Reichold M, et al. Epilepsy, ataxia, sensorineural deafness, tubulopathy, and KCNJ10 mutations. N Engl J Med. 2009;360:1960–1970. - PMC - PubMed
    1. Bringmann A, Pannicke T, Biedermann B, Francke M, Iandiev I, Grosche J, et al. Role of retinal glial cells in neurotransmitter uptake and metabolism. Neurochem Int. 2009;54:143–160. - PubMed
    1. Connors NC, Kofuji P. Potassium channel Kir4.1 macromolecular complex in retinal glial cells. Glia. 2006;53:124–131. - PubMed
    1. Djukic B, Casper KB, Philpot BD, Chin LS, McCarthy KD. Conditional knock-out of Kir4.1 leads to glial membrane depolarization, inhibition of potassium and glutamate uptake, and enhanced short-term synaptic potentiation. J Neurosci. 2007;27:11354–11365. - PMC - PubMed
    1. Dong CJ, Agey P, Hare WA. Origins of the electroretinogram oscillatory potentials in the rabbit retina. Vis Neurosci. 2004;21:533–543. - PubMed

Publication types

Substances