. 2011 Apr 22;286(16):14383-95.
doi: 10.1074/jbc.M110.208660. Epub 2011 Feb 7.

Protein targeting to exosomes/microvesicles by plasma membrane anchors

Affiliations

Protein targeting to exosomes/microvesicles by plasma membrane anchors

Beiyi Shen et al. J Biol Chem. .

Abstract

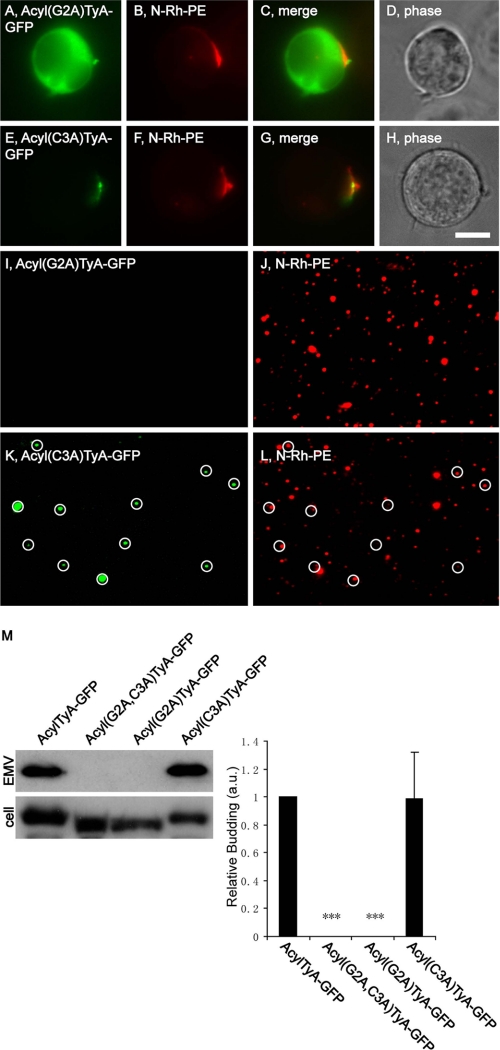
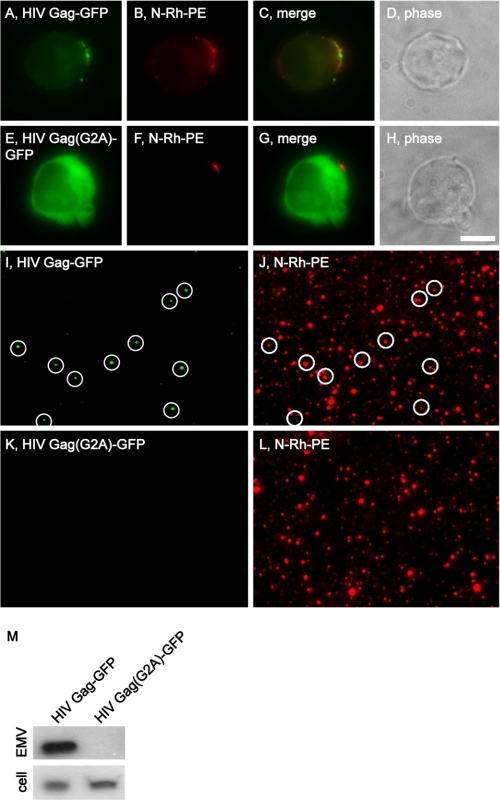
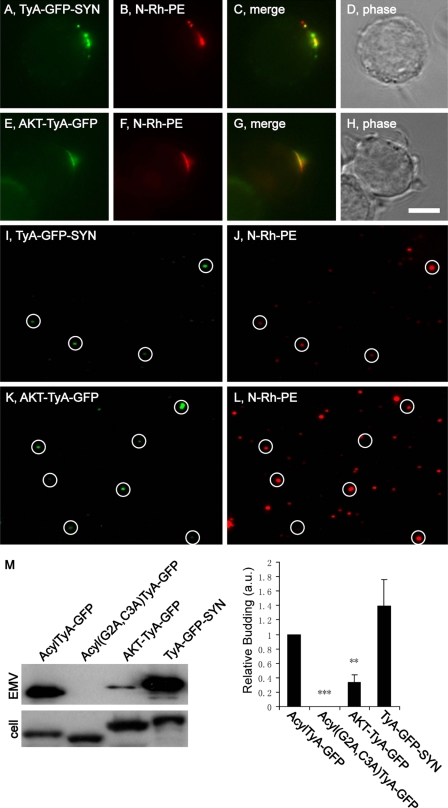
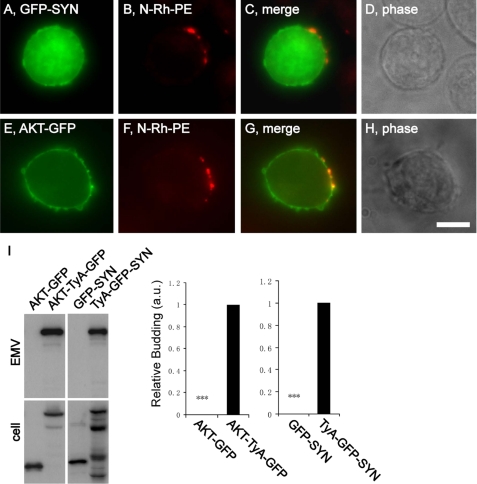
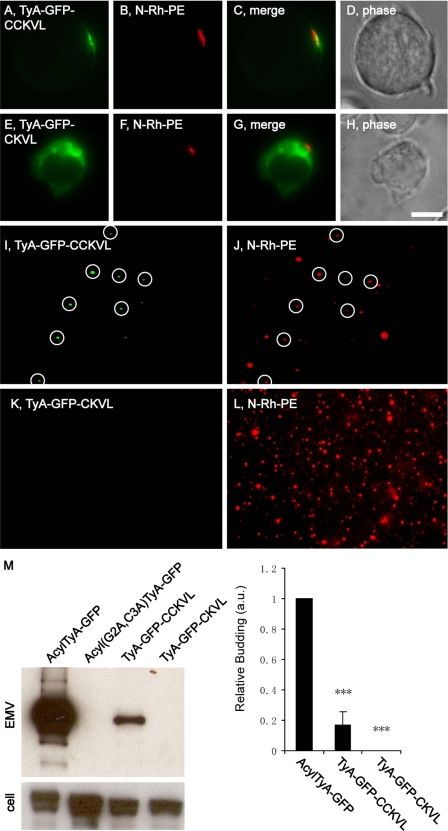
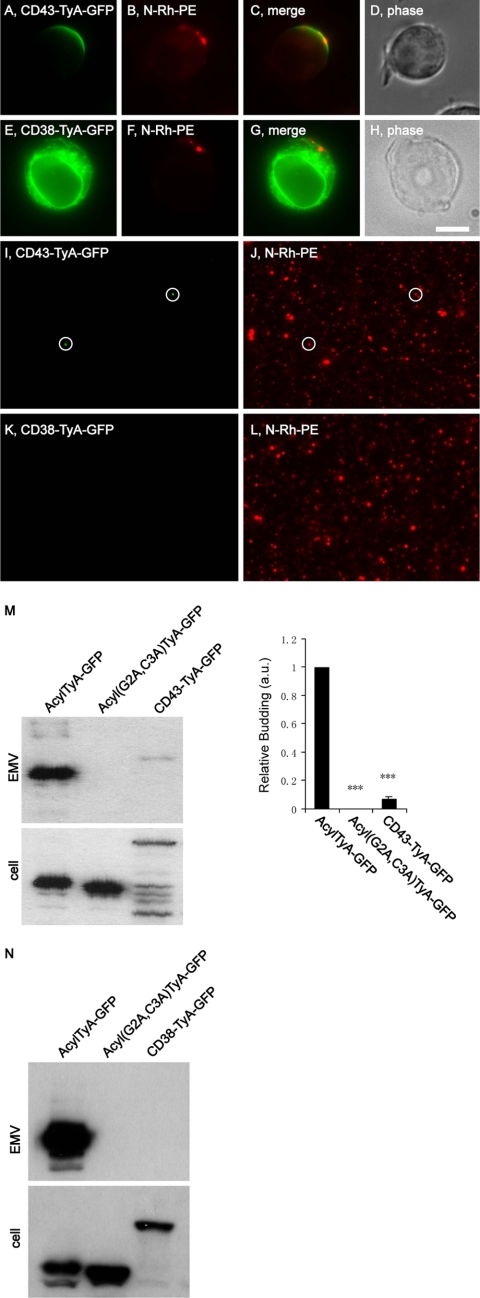
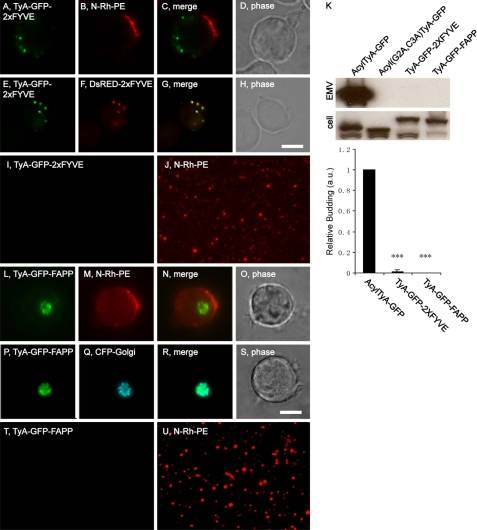
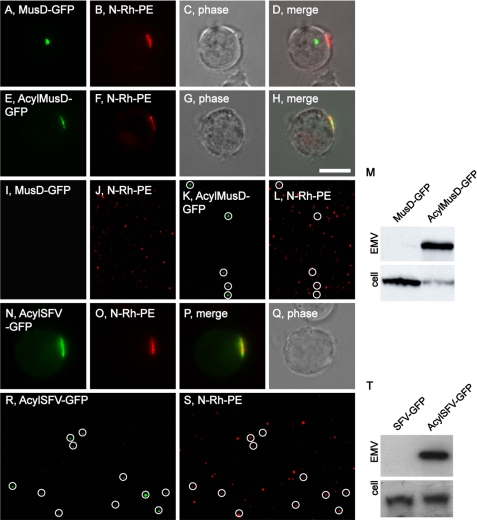
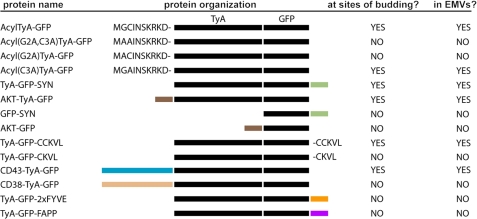
Animal cells secrete small vesicles, otherwise known as exosomes and microvesicles (EMVs). A short, N-terminal acylation tag can target a highly oligomeric cytoplasmic protein, TyA, into secreted vesicles (Fang, Y., Wu, N., Gan, X., Yan, W., Morell, J. C., and Gould, S. J. (2007) PLoS Biol. 5, 1267-1283). However, it is not clear whether this is true for other membrane anchors or other highly oligomeric, cytoplasmic proteins. We show here that a variety of plasma membrane anchors can target TyA-GFP to sites of vesicle budding and into EMVs, including: (i) a myristoylation tag; (ii) a phosphatidylinositol-(4,5)-bisphosphate (PIP(2))-binding domain; (iii), a phosphatidylinositol-(3,4,5)-trisphosphate-binding domain; (iv) a prenylation/palmitoylation tag, and (v) a type-1 plasma membrane protein, CD43. However, the relative budding efficiency induced by these plasma membrane anchors varied over a 10-fold range, from 100% of control (AcylTyA-GFP) for the myristoylation tag and PIP(2)-binding domain, to one-third or less for the others, respectively. Targeting TyA-GFP to endosome membranes by fusion to a phosphatidylinositol 3-phosphate-binding domain induced only a slight budding of TyA-GFP, ∼2% of control, and no budding was observed when TyA-GFP was targeted to Golgi membranes via a phosphatidylinositol 4-phosphate-binding domain. We also found that a plasma membrane anchor can target two other highly oligomeric, cytoplasmic proteins to EMVs. These observations support the hypothesis that plasma membrane anchors can target highly oligomeric, cytoplasmic proteins to EMVs. Our data also provide additional parallels between EMV biogenesis and retrovirus budding, as the anchors that induced the greatest budding of TyA-GFP are the same as those that mediate retrovirus budding.


Figures

FIGURE 1.
FIGURE 1.
The myristoyl attachment site is required for targeting AcylTyA-GFP to sites of vesicle budding and into EMVs. A–H, fluorescence and phase microscopy images of N-Rh-PE-labeled Jurkat T-cells expressing Acyl(G2A)TyA-GFP (A–D) or Acyl(C3A)TyA-GFP (E–H). Scale bar, 10 μm. I–L, fluorescence microscopy images of EMVs produced by N-Rh-PE-labeled Jurkat T-cells expressing Acyl(G2A)TyA-GFP (I and J) or Acyl(C3A)TyA-GFP (K and L). The white circles show the position of GFP-positive vesicles, some of which also possessed N-Rh-PE fluorescence. M, anti-GFP immunoblot of EMV and cell lysates prepared from Jurkat T-cells expressing AcylTyA-GFP, Acyl(G2A,C3A)TyA-GFP, Acyl(G2A)TyA-GFP, or Acyl(C3A)TyA-GFP. The bar graph to the right shows the average ± 1 S.D. of the relative budding calculated from band intensities (EMV/(EMV + cell)) relative to the AcylTyA-GFP control, which were determined by densitometric analysis of immunoblot films. Results noted with three asterisks have a p value of < 0.0005.
FIGURE 2.
FIGURE 2.
The myristoyl attachment site is required for targeting HIV Gag-GFP to sites of vesicle budding and EMVs. A–H, fluorescence and phase microscopy images of N-Rh-PE-labeled Jurkat T-cells expressing HIV Gag-GFP (A–D) or HIV Gag(G2A)-GFP (E–H). Scale bar, 10 μm. I–L, fluorescence microscopy images of EMVs produced by N-Rh-PE-labeled Jurkat T-cells expressing (I and J) HIV Gag-GFP or HIV Gag(G2A)-GFP (K and L). The white circles show the position of GFP-positive vesicles, some of which also possessed N-Rh-PE fluorescence. M, anti-GFP immunoblot of EMV and cell lysates prepared from Jurkat T-cells expressing HIV Gag-GFP or HIV Gag(G2A)-GFP.
FIGURE 3.
FIGURE 3.
PIP2- and PIP3-binding domains can target TyA-GFP to N-Rh-PE-enriched domains of plasma membrane and into EMVs. A–H, fluorescence and phase microscopy images of N-Rh-PE-labeled Jurkat T-cells expressing TyA-GFP-SYN (A–D) or AKT-TyA-GFP (E–H). Scale bar, 10 μm. I–L, fluorescence microscopy images of EMVs produced by N-Rh-PE-labeled Jurkat T-cells expressing TyA-GFP-SYN (I and J) or AKT-TyA-GFP (K and L). The white circles show the position of GFP-positive vesicles, some of which also possessed N-Rh-PE fluorescence. M, anti-GFP immunoblot of EMV and cell lysates prepared from Jurkat T-cells expressing AcylTyA-GFP, Acyl(G2A,C3A)TyA-GFP, TyA-GFP-SYN, or AKT-TyA-GFP. The bar graph to the right shows the average ± 1 S.D. of the relative budding calculated from band intensities (EMV/(EMV + cell)) relative to the AcylTyA-GFP control, which were determined by densitometric analysis of immunoblot films. Two asterisks reflect a p value of < 0.005; three asterisks reflect a p value of < 0.0005.
FIGURE 4.
FIGURE 4.
PIP2- and PIP3-binding domains do not target GFP to sites of vesicle budding or to EMVs. A–H, fluorescence and phase microscopy images of N-Rh-PE-labeled Jurkat T-cells expressing GFP-SYN (A–D) or AKT-GFP (E–H). Scale bar, 10 μm. I, anti-GFP immunoblot of EMV and cell lysates prepared from Jurkat T-cells expressing AKT-GFP, AKT-TyA-GFP, GFP-SYN, or TyA-GFP-SYN. The bar graph to the right shows the average ± 1 S.D. of the relative budding calculated from band intensities (EMV/(EMV + cell)) relative to the AcylTyA-GFP control, which were determined by densitometric analysis of immunoblot films. Three asterisks reflect a p value of < 0.0005.
FIGURE 5.
FIGURE 5.
A C-terminal prenylation/palmitoylation tag targets TyA-GFP to EMVs. A–H, fluorescence and phase microscopy images of N-Rh-PE-labeled Jurkat T-cells expressing TyA-GFP-CCKVL (A–D) or TyA-GFP-CKVL (E–H). Scale bar, 10 μm. I–L, fluorescence microscopy images of EMVs produced by N-Rh-PE-labeled Jurkat T-cells expressing TyA-GFP-CCKVL (I and J) or TyA-GFP-CKVL (K and L). The white circles show the position of GFP-positive vesicles, some of which also possessed N-Rh-PE fluorescence. M, anti-GFP immunoblot of EMV and cell lysates prepared from Jurkat T-cells expressing AcylTyA-GFP, Acyl(G2A,C3A)TyA-GFP, TyA-GFP-CCKVL, or TyA-GFP-CKVL. The bar graph to the right shows the average ± 1 S.D. of the relative budding calculated from band intensities (EMV/(EMV + cell)) relative to the AcylTyA-GFP control, which were determined by densitometric analysis of immunoblot films. Three asterisks reflect a p value of < 0.0005.
FIGURE 6.
FIGURE 6.
Fusions of TyA-GFP to integral plasma membrane proteins. A–H, fluorescence and phase microscopy images of N-Rh-PE-labeled Jurkat T-cells expressing CD43-TyA-GFP (A–D) or CD38-TyA-GFP (E–H). Scale bar, 10 μm. I–L, fluorescence microscopy images of EMVs produced by N-Rh-PE-labeled Jurkat T-cells expressing CD43-TyA-GFP (I and J) or CD38-TyA-GFP (K and L). The white circles show the position of GFP-positive vesicles, some of which also possessed N-Rh-PE fluorescence. M, anti-GFP immunoblot of EMV and cell lysates prepared from Jurkat T-cells expressing AcylTyA-GFP, Acyl(G2A,C3A)TyA-GFP, or CD43-TyA-GFP. The bar graph to the right shows the average ± 1 S.D. of the relative budding calculated from band intensities (EMV/(EMV + cell)) relative to the AcylTyA-GFP control, which were determined by densitometric analysis of immunoblot films. Three asterisks reflect a p value of < 0.0005. N, anti-GFP immunoblot of EMV and cell lysates prepared from Jurkat T-cells expressing AcylTyA-GFP, Acyl(G2A,C3A)TyA-GFP, or CD38-TyA-GFP.
FIGURE 7.
FIGURE 7.
PI3P-binding and phosphatidylinositol 4-phosphate-binding domains do not induce robust budding of TyA-GFP. A–D, fluorescence and phase microscopy images of N-Rh-PE-labeled Jurkat T-cells expressing TyA-GFP-2xFYVE. E–H, fluorescence and phase microscopy images of Jurkat T-cells expressing TyA-GFP-2xFYVE and DsRED-2xFYVE. Scale bar, 10 μm. I and J, fluorescence microscopy images of EMVs produced by N-Rh-PE-labeled Jurkat T-cells expressing TyA-GFP-2xFYVE. K, anti-GFP immunoblot of EMV and cell lysates prepared from Jurkat T-cells expressing AcylTyA-GFP, Acyl(G2A,C3A)TyA-GFP, TyA-GFP-2xFYVE, or TyA-GFP-FAPP. The bar graph below the immunoblot shows the average ± 1 S.D. of the relative budding calculated from band intensities (EMV/(EMV + cell)) relative to the AcylTyA-GFP control, which were determined by densitometric analysis of immunoblot films. Three asterisks reflect a p value of < 0.0005. L–O, fluorescence and phase microscopy images of N-Rh-PE-labeled Jurkat T-cells expressing TyA-GFP-FAPP. P–S, fluorescence and phase microscopy images of Jurkat T-cells expressing TyA-GFP-FAPP and CFP-Golgi. Scale bar, 10 μm. T and U, fluorescence microscopy images of EMVs produced by N-Rh-PE-labeled Jurkat T-cells expressing TyA-GFP-FAPP.
FIGURE 8.
FIGURE 8.
The 10-amino acid-long acylation tag targets MusD and SFV to sites of vesicle budding and into EMVs. A–H, fluorescence and phase microscopy images of N-Rh-PE-labeled Jurkat T-cells expressing MusD-GFP (A–D) or AcylMusD-GFP (E–H). Scale bar, 10 μm. I–L, fluorescence microscopy images of EMVs produced by N-Rh-PE-labeled Jurkat T-cells expressing MusD-GFP (I and J) or AcylMusD-GFP (K and L). The white circles show the position of GFP-positive vesicles, some of which also possessed N-Rh-PE fluorescence. M, anti-GFP immunoblot of EMV and cell lysates prepared from Jurkat T-cells expressing MusD-GFP or AcylMusD-GFP. N–Q, fluorescence and phase microscopy images of N-Rh-PE-labeled Jurkat T-cells expressing AcylSFV-GFP. R and S, fluorescence microscopy images of EMVs produced by N-Rh-PE-labeled Jurkat T-cells expressing AcylSFV-GFP. The white circles show the position of GFP-positive vesicles, some of which also possessed N-Rh-PE fluorescence. T, anti-GFP immunoblot of EMV and cell lysates prepared from Jurkat T-cells expressing SFV-GFP or AcylSFV-GFP.
FIGURE 9.
FIGURE 9.
Line diagram of TyA-GFP fusion proteins, their linear organization, sorting to sites of budding, and secretion from the cell in EMVs.

References

    1. Schorey J. S., Bhatnagar S. (2008) Traffic 9, 871–881 - PMC - PubMed
    1. Théry C., Ostrowski M., Segura E. (2009) Nat. Rev. Immunol. 9, 581–593 - PubMed
    1. Simons M., Raposo G. (2009) Curr. Opin. Cell Biol. 21, 575–581 - PubMed
    1. Gould S. J., Booth A. M., Hildreth J. E. (2003) Proc. Natl. Acad. Sci. U.S.A. 100, 10592–10597 - PMC - PubMed
    1. Trams E. G., Lauter C. J., Salem N., Jr., Heine U. (1981) Biochim. Biophys. Acta 645, 63–70 - PubMed

Publication types

Substances

LinkOut - more resources