. 2011 Apr 29;286(17):15361-76.
doi: 10.1074/jbc.M110.204172. Epub 2011 Feb 7.

Investigation of the functional link between ATM and NBS1 in the DNA damage response in the mouse cerebellum

Affiliations

Investigation of the functional link between ATM and NBS1 in the DNA damage response in the mouse cerebellum

Inbal Dar et al. J Biol Chem. .

Abstract

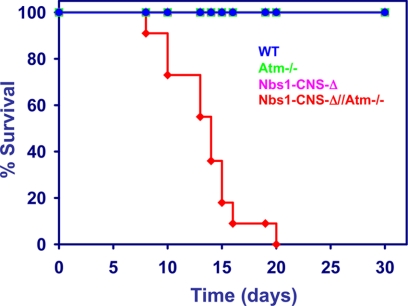
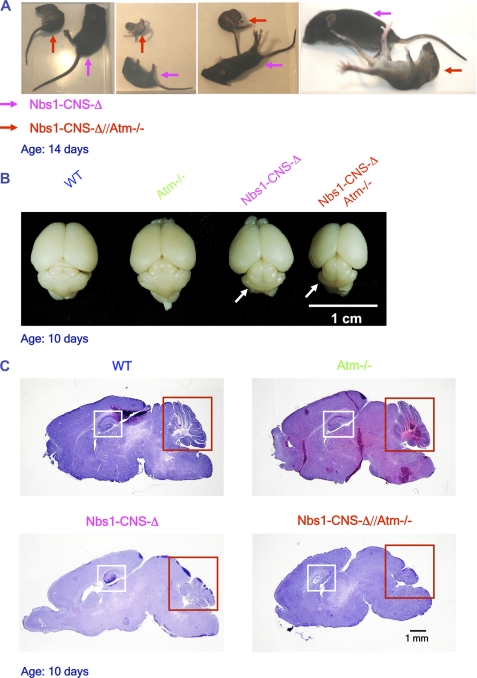
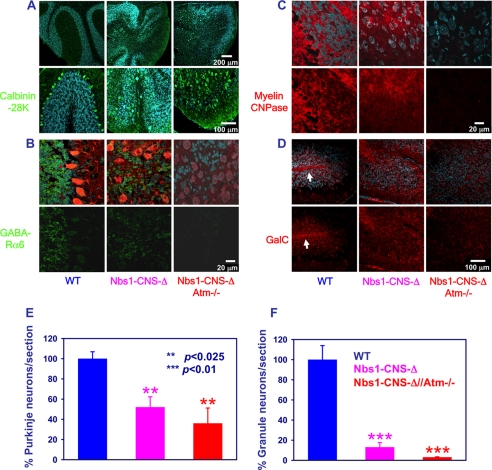
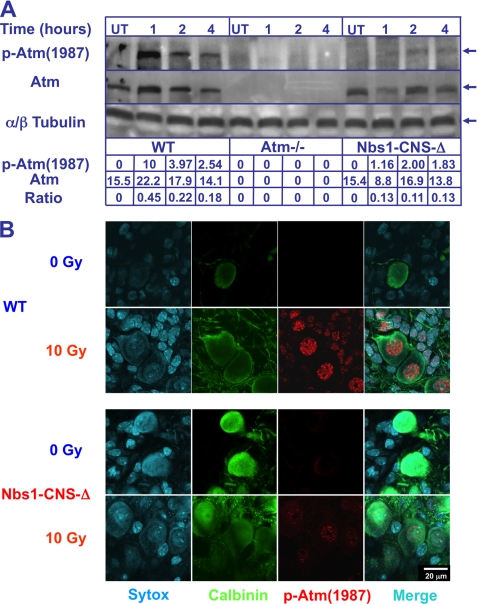
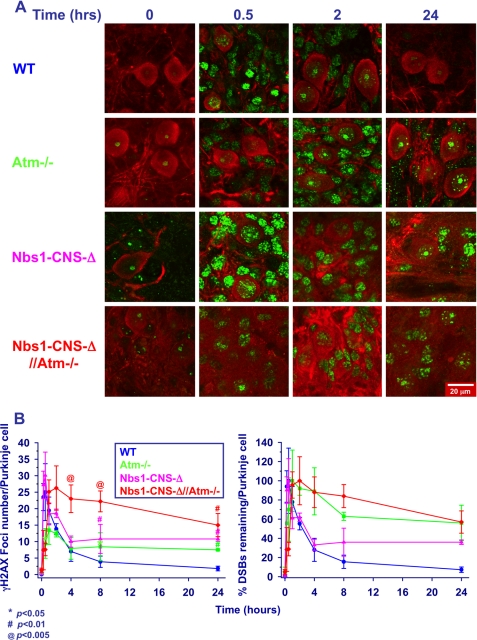
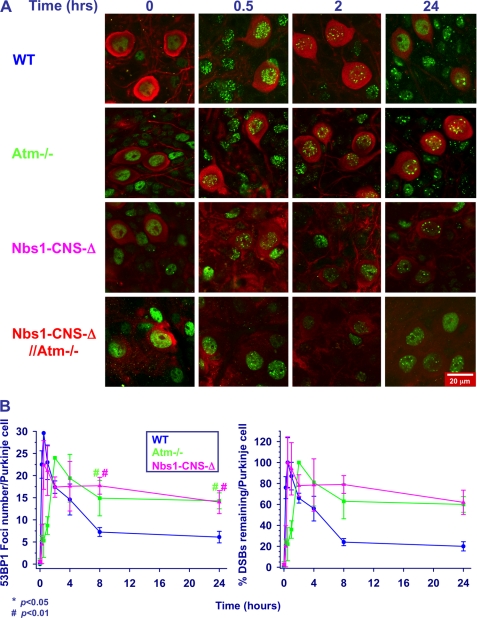
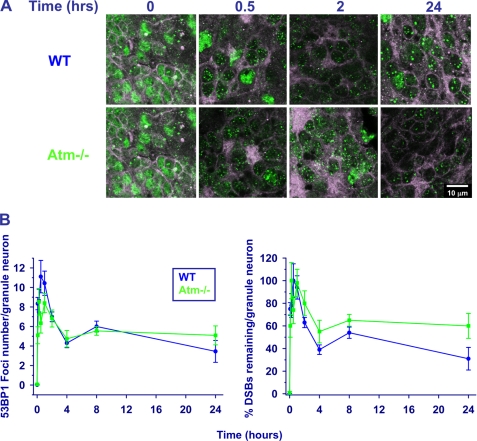
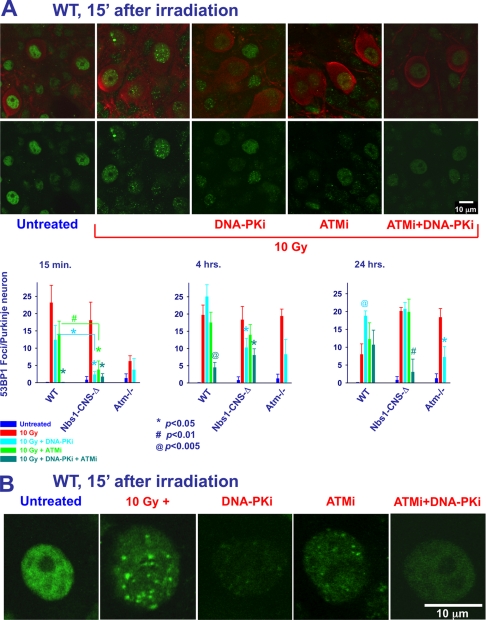
Ataxia-telangiectasia (A-T) and Nijmegen breakage syndrome (NBS) are related genomic instability syndromes characterized by neurological deficits. The NBS1 protein that is defective in NBS is a component of the Mre11/RAD50/NBS1 (MRN) complex, which plays a major role in the early phase of the complex cellular response to double strand breaks (DSBs) in the DNA. Among others, Mre11/RAD50/NBS1 is required for timely activation of the protein kinase ATM (A-T, mutated), which is missing or inactivated in patients with A-T. Understanding the molecular pathology of A-T, primarily its cardinal symptom, cerebellar degeneration, requires investigation of the DSB response in cerebellar neurons, particularly Purkinje cells, which are the first to be lost in A-T patients. Cerebellar cultures derived from mice with different mutations in DNA damage response genes is a useful experimental system to study malfunctioning of the damage response in the nervous system. To clarify the interrelations between murine Nbs1 and Atm, we generated a mouse strain with specific disruption of the Nbs1 gene in the central nervous system on the background of general Atm deficiency (Nbs1-CNS-Δ//Atm(-/-)). This genotype exacerbated several features of both conditions and led to a markedly reduced life span, dramatic decline in the number of cerebellar granule neurons with considerable cerebellar disorganization, abolishment of the white matter, severe reduction in glial cell proliferation, and delayed DSB repair in cerebellar tissue. Combined loss of Nbs1 and Atm in the CNS significantly abrogated the DSB response compared with the single mutation genotypes. Importantly, the data indicate that Atm has cellular roles not regulated by Nbs1 in the murine cerebellum.


Figures

FIGURE 1.
FIGURE 1.
Life span of mice with different Nbs1 and Atm genotypes. Survival curves are shown for the different genotypes. n = 11 (84).
FIGURE 2.
FIGURE 2.
Growth retardation, severe ataxia, microcephaly, and cerebellar developmental defects in Nbs1-CNS-Δ//Atm−/− mice. A, marked growth retardation was detected in14-day-old Nbs1-CNS-Δ//Atm−/− and Nbs1-CNS-Δ mice (red and pink arrows, respectively). The posture of the Nbs1-CNS-Δ//Atm−/− shows severe ataxia. B, reduced cerebellar size in Nbs1-CNS-Δ//Atm−/− compared with the rest of the Nbs1/Atm genotypes is shown. The brains were isolated from 10-day-old mice. C, histological analysis of P-10 mid-sagittal brain sections (20 μm) is shown. Hematoxylin and eosin staining. Bar = 1 mm.
FIGURE 3.
FIGURE 3.
The Nbs1-CNS-Δ/Atm−/− double mutant genotype exacerbates the effects of Nbs1 inactivation. A, the upper panel shows Purkinje cell organization in the various genotypes, and the lower panel shows a merged picture of Purkinje cells (calbindin K28, green), cell nuclei (Sytox blue) in higher magnification. Scale bars: 200 μm (upper) and 100 μm (lower). B, brain sections were prepared from 14-day-old Nbs1+/+//Atm+/+, Nbs1-CNS-Δ//Atm+/+, and Nbs1-CNS-Δ//Atm−/− mice after fixation with 4% paraformaldehyde and immunoreacted with anti-γ-aminobutyric acid receptor α-6 (GABA-Rα6; a marker of cerebellar granule neurons, green). Purkinje cells were labeled with calbindin K28 (red) and cell nuclei with Sytox blue. Scale bar = 20 μm. C, cerebellar sections were prepared from the three genotypes on postnatal day 14, stained with anti-myelin 2′,3′-cyclic nucleotide 3′-phosphodiesterase (a key enzyme in myelin formation, red) antibody, which labels the myelin, and co-stained with Sytox blue, which labels cell nuclei. Scale bar = 20 μm. D, cerebellar sections of the indicated genotypes were made on postnatal day 14, reacted with an anti-GalC antibody (red), which labels mature oligodendrocytes and co-stained with Sytox blue. The white arrows point to intrafoliar white matter. Scale bar = 100 μm. The number of Purkinje neurons (E) and granule cells (F) were counted for each genotype. The experiments were performed in cultures from at least three different mice for each genotype. Statistical analysis was performed using two-tailed Student's t test (*, p < 0.05; **, p < 0.01; ***, p < 0.005 between WT and the rest of the genotypes).
FIGURE 4.
FIGURE 4.
The Nbs1-CNS-Δ/Atm−/− double mutant genotype reduces cell proliferation and increases cell death in the cerebellum. A, P5 cerebellar sections derived from the Nbs1-CNS-Δ//Atm−/− and WT were immunoreacted with Ki67 (marker for cell proliferation). EGL, external granular layer; IGL, internal granular layer. B, quantification of Ki67-positive cells is shown. C, P10 cerebellar sections derived from the Nbs1-CNS-Δ//Atm−/− and WT were immunoreacted with calbindin (marker of Purkinje neurons) active caspase 3 (marker for apoptosis). White arrows point at Purkinje neurons, which are active caspase 3-positive cells. D, quantification of active caspase 3-positive cells is shown. E, P10 cerebellar sections derived from the Nbs1-CNS-Δ//Atm−/− and WT were stained with Fluoro-Jade (marker of degenerative process). F, dissociated glial cell cultures were prepared from 1–2-day-old mice of various Nbs1/Atm genotypes. Bar = 25 μm. G, identical numbers of cells were taken from 1 week cultures, re-plated, and counted after 5, 10, and 15 days. The experiments were performed in cultures from at least three mice for each genotype. Statistical analysis was performed using two-tailed Student's t test. Error bars represent S.E. Green asterisks show the statistical significance between Atm−/− and Nbs1-CNS-Δ//Atm−/−; pink asterisks show the statistical significance between Nbs1-CNS-Δ and Nbs1-CNS-Δ//Atm−/−. *, p < 0.05; **, p < 0.02; ***, p < 0.01.
FIGURE 5.
FIGURE 5.
Partial damage-induced Atm autophosphorylation in Nbs1-CNS-Δ cerebellar extract and Purkinje neurons. A, whole cerebella were isolated from untreated (UT) and irradiated (10 Gy) 1-month-old WT, Atm−/−, and Nbs1-CNS-Δ mice. Cerebellar proteins were extracted and immunoblotted with anti-Atm Ser(P)-1987. Total Atm and tubulin served as loading controls. Ratios represent the relative alterations of phosphorylated Atm compared with total Atm protein. B, cerebellar organotypic cultures derived from WT and Nbs1-CNS-Δ were exposed to 10 Gy, fixed, and 2 h later immunoreacted with an anti-Atm Ser(P)-1987 antibody (red). Purkinje neurons were labeled with calbindin D28K (green).
FIGURE 6.
FIGURE 6.
Dynamics of radiation-induced γH2AX foci in cerebellar organotypic cultures of various Nbs1/Atm mutants. A, after irradiation with 10 Gy of ionizing radiation, the cultures were fixed and reacted with an anti-γH2AX antibody (green) at the indicated time points. B, the number of γH2AX foci per nucleus of Purkinje neurons was measured using the Image Pro software in 10–20 nuclei for each treatment/genotype. The experiments were performed in cultures from at least three mice for each genotype. Statistical analysis was performed using two-tailed Student's t test (*, p < 0.05; #, p < 0.01; @, p < 0.005 between WT and the rest of the genotypes). Scale bar = 20 μm.
FIGURE 7.
FIGURE 7.
Dynamics of radiation-induced 53BP1 foci in cerebellar organotypic cultures of various Nbs1/Atm mutants. A, after irradiation with 10 Gy of ionizing radiation, the cultures were fixed and reacted with an anti-53BP1 antibody (green) at the indicated time points. Purkinje neurons were labeled with calbindin D28K (red). B, the number of 53BP1 foci per nucleus was measured using the Image Pro software in 10–20 nuclei for each treatment/genotype at each culture. The experiments were performed in cultures from at least three mice per genotype. Statistical analysis was performed using two-tailed Student's t test (*, p < 0.05; #, p < 0.01 between WT and the rest of the genotypes). Scale bar = 20 μm.
FIGURE 8.
FIGURE 8.
Dynamics of radiation-induced 53BP1 foci in granule neurons in organotypic cultures derived from various Nbs1/Atm mutants. A, after irradiation with 10 Gy of ionizing radiation, the cultures were fixed and reacted with an anti-53BP1 antibody (green) at the indicated time points. Purkinje neurons were labeled with calbindin D28K (red). B, the number of 53BP1 foci per nucleus was measured using the Image Pro software in 10–20 nuclei for each treatment/genotype at each culture. The experiments were performed in cultures from at least 3 mice per genotype. Statistical analysis was performed using two-tailed Student's t test (*, p < 0.05; #, p < 0.01 between WT and the rest of the genotypes). Scale bar = 20 μm.
FIGURE 9.
FIGURE 9.
Proteins kinases other than Atm and DNA-PK are capable of phosphorylating H2AX in Purkinje neurons. A, organotypic cultures derived from various Nbs1 and Atm genotypes were incubated with 2 μg/ml Atm inhibitor KU55933 (ATMi) or 2 μg/ml DNA-PK inhibitor NU7026 (DNA-PKi). Cultures were then treated with 10 Gy of ionizing radiation, fixed at 15 min and 4 and 24 h after the irradiation and reacted with an anti-γH2AX antibody (green). Purkinje neurons were labeled with calbindin D28K (red). The number of γH2AX foci per nucleus of Purkinje neurons was measured using the Image Pro software in 10–20 nuclei for each treatment/genotype. The experiments were performed in cultures from at least 3 mice for each genotype (*, p < 0.05; #, p < 0.01; @, p < 0.005 between irradiated Purkinje neurons and Purkinje neurons that had been exposed to Atm and DNA-PK inhibitors). Scale bar = 10 μm. B, higher magnification of WT micrographs show the effect of Atm and DNA-PK inhibitors on the intensity and size of γH2AX nuclear foci.
FIGURE 10.
FIGURE 10.
Involvement of Atm and DNA-PK in damage-induced 53BP1 foci in cerebellar neurons. A, organotypic cultures derived from various Nbs1 and Atm genotypes were incubated with 2 μg/ml Atm inhibitor KU55933 (ATMi) or 2 μg/ml DNA-PK inhibitor NU7026 (DNA-PKi). The cultures were then treated with 10 Gy of ionizing radiation, fixed at 15 min and 4 and 24 h after irradiation, and reacted with an anti-53BP1 antibody (green). Purkinje neurons were labeled with calbindin D28K (red). The number of 53BP1 foci per nucleus of Purkinje neurons was measured using the Image Pro software in 10–20 nuclei for each treatment/genotype. The experiments were performed in cultures from at least three mice for each genotype. Scale bar = 10 μm. B, higher magnification of WT micrographs show the effect of Atm and DNA-PK inhibitors on the intensity and size of 53BP1 nuclear foci.

Similar articles

Cited by

References

    1. Bassing C. H., Alt F. W. (2004) DNA Repair 3, 781–796 - PubMed
    1. Harrison J. C., Haber J. E. (2006) Annu. Rev. Genet. 40, 209–235 - PubMed
    1. Bekker-Jensen S., Mailand N. (2010) DNA Repair 9, 1219–1228 - PubMed
    1. Ciccia A., Elledge S. J. (2010) Mol. Cell 40, 179–204 - PMC - PubMed
    1. van Gent D. C., van der Burg M. (2007) Oncogene 26, 7731–7740 - PubMed

Publication types

Substances