

Cross-national comparisons of time trends in overweight inequality by socioeconomic status among women using repeated cross-sectional surveys from 37 developing countries, 1989-2007
- PMID: 21300855
- PMCID: PMC3105263
- DOI: 10.1093/aje/kwq428
Cross-national comparisons of time trends in overweight inequality by socioeconomic status among women using repeated cross-sectional surveys from 37 developing countries, 1989-2007
Abstract
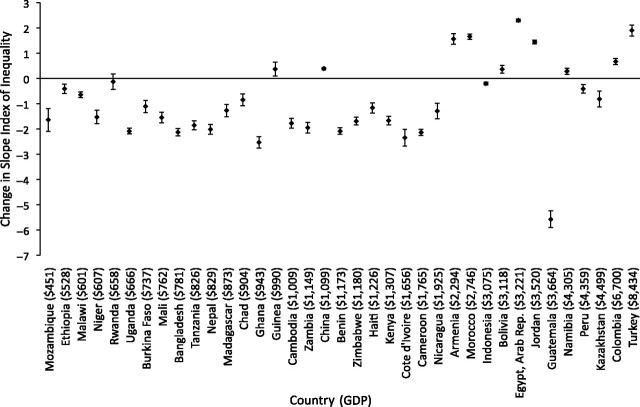
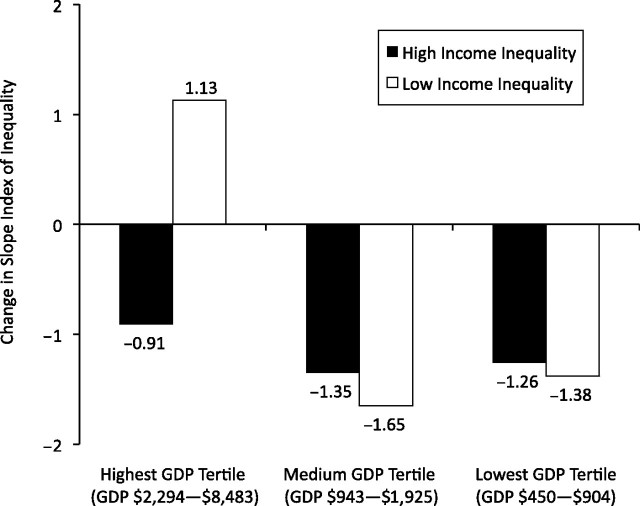
Chronic diseases are now among the leading causes of morbidity and mortality in lower income countries. Although traditionally related to higher individual socioeconomic status (SES) in these contexts, the associations between SES and chronic disease may be actively changing. Furthermore, country-level contextual factors, such as economic development and income inequality, may influence the distribution of chronic disease by SES as well as how this distribution has changed over time. Using overweight status as a health indicator, the authors studied repeated cross-sectional data from women aged 18-49 years in 37 developing countries to assess within-country trends in overweight inequalities by SES between 1989 and 2007 (n=405,550). Meta-regression was used to examine the associations between gross domestic product and disproportionate increases in overweight prevalence by SES, with additional testing for modification by country-level income inequality. In 27 of 37 countries, higher SES (vs. lower) was associated with higher gains in overweight prevalence; in the remaining 10 countries, lower SES (vs. higher) was associated with higher gains in overweight prevalence. Gross domestic product was positively related to faster increase in overweight prevalence among the lower wealth groups. Among countries with a higher gross domestic product, lower income inequality was associated with faster overweight growth among the poor.
© The Author 2011. Published by Oxford University Press on behalf of the Johns Hopkins Bloomberg School of Public Health. All rights reserved.
Figures
References
-
- Mokdad AH, Ford ES, Bowman BA, et al. Prevalence of obesity, diabetes, and obesity-related health risk factors, 2001. JAMA. 2003;289(1):76–79. - PubMed
-
- Popkin BM. The world is fat. Sci Am. 2007;297(3):88–95. - PubMed
-
- Kaplan GA, Keil JE. Socioeconomic factors and cardiovascular disease: a review of the literature. Circulation. 1993;88(4 pt 1):1973–1998. - PubMed
-
- Sobal J, Stunkard AJ. Socioeconomic status and obesity: a review of the literature. Psychol Bull. 1989;105(2):260–275. - PubMed
-
- Monteiro CA, Conde WL, Lu B, et al. Obesity and inequities in health in the developing world. Int J Obes Relat Metab Disord. 2004;28(9):1181–1186. - PubMed
Publication types
MeSH terms
Grants and funding
LinkOut - more resources
Full Text Sources
Medical
