. 2011 Feb 14;208(2):395-407.
doi: 10.1084/jem.20100466. Epub 2011 Feb 7.

PD-1 and LAG-3 inhibitory co-receptors act synergistically to prevent autoimmunity in mice

Affiliations

PD-1 and LAG-3 inhibitory co-receptors act synergistically to prevent autoimmunity in mice

Taku Okazaki et al. J Exp Med. .

Abstract

Stimulatory and inhibitory co-receptors play fundamental roles in the regulation of the immune system. We describe a new mouse model of spontaneous autoimmune disease. Activation-induced cytidine deaminase-linked autoimmunity (aida) mice harbor a loss-of-function mutation in the gene encoding lymphocyte activation gene 3 (LAG-3), an inhibitory co-receptor. Although LAG-3 deficiency alone did not induce autoimmunity in nonautoimmune-prone mouse strains, it induced lethal myocarditis in BALB/c mice deficient for the gene encoding the inhibitory co-receptor programmed cell death 1 (PD-1). In addition, LAG-3 deficiency alone accelerated type 1 diabetes mellitus in nonobese diabetic mice. These results demonstrate that LAG-3 acts synergistically with PD-1 and/or other immunoregulatory genes to prevent autoimmunity in mice.


Figures

Figure 1.
Figure 1.
Spontaneous development of autoimmune diseases in AID-deficient mice. (A) Survival curves of BALB/c-Pdcd1−/−Aicda−/− (n = 32), BALB/c-Pdcd1−/−Aicda+/− (n = 20), BALB/c-Pdcd1+/−Aicda−/− (n = 28), and BALB/c wild-type (n = 13) mice. (B) Representative histology of the heart from BALB/c wild-type and BALB/c-Pdcd1−/−Aicda−/− mice. (C) Incidence of type 1 diabetes in NOD-Aicda−/−, NOD-Aicda+/−, and NOD wild-type female (left, n = 9, 20, and 16, respectively) and male (right, n = 13, 36, and 16, respectively) mice. (D) The percentage of islets with each grade of insulitis (0, 1, 2, and 3) in female NOD wild-type (+/+) and NOD-Aicda−/− (−/−) mice at 7 wk of age. More than 200 islets from five NOD wild-type and six NOD-Aicda−/− mice were analyzed.
Figure 2.
Figure 2.
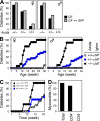
B cells are not required for the spontaneous development of autoimmune diseases in AID-deficient mice. (A) Incidence of type 1 diabetes by 18 wk in female (left) and male (right) NOD-Aicda−/− (−/−), NOD-Aicda+/− (+/−), and NOD wild-type (+/+) mice that were kept in germ-free conditions (GF; n = 13, 9, and 8 for female and n = 10, 5, and 12 for male mice, respectively) or moved to SPF conditions (GF => SPF) at 5 wk of age (n = 11, 17, and 5 for female and n = 5, 17, and 6 for male mice, respectively). (B) Incidence of type 1 diabetes in NOD-μMT-Aicda−/−, NOD-μMT-Aicda+/−, and NOD-μMT female (n = 13, 26, and 10, respectively) and male (n = 10, 24, and 17, respectively) mice. Ighm, immunoglobulin heavy constant mu gene. (C) Incidence of type 1 diabetes in NOD-SCID recipients of wild-type NOD BM (+/+ => +/+, n = 12) and NOD-SCID-Aicda−/− recipients of wild-type NOD BM (+/+ => −/−, n = 14), and NOD-SCID recipients of NOD-Aicda−/− BM (−/− => +/+, n = 4). (D) Incidence of myocarditis by 7 wk after the adoptive transfer of total (n = 4), CD4+ (n = 10), or CD4-depleted (n = 19) spleen cells from moribund BALB/c-Pdcd1−/−Aicda−/− mice into BALB/c-Rag2−/− mice.
Figure 3.
Figure 3.
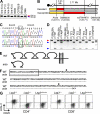
Identification of a 2-bp deletion in the LAG-3 gene. (A) Presence of CBA- or BALB/c-derived alleles at D6Mit300 in myocarditis-susceptible (X and D) and -resistant (Y and K) mouse lines was analyzed by simple sequence length polymorphism (SSLP). Representative data of more than three independent experiments are shown. (B) Origins of the chromosomal regions for the myocarditis-resistant (top) and -susceptible (bottom) BALB/c-Pdcd1−/−Aicda−/− lines. CBA, yellow; undetermined, red; BALB/c, gray. The causal gene was mapped between Aicda and rs37864878. (C) Sequencing of the mouse LAG-3 gene of disease-susceptible (top) and -resistant (bottom) mouse lines, with a reference sequence (http://ncbi.nlm.nih.gov). Bases deleted in susceptible strain are boxed. Representative data of more than three independent experiments are shown. (D) Restriction fragment length polymorphism (RFLP) analysis of the LAG-3 gene in BALB/c wild-type mice, BALB/c-Lag3+/aida mice, BALB/c-Lag3aida/aida mice, TT2-Aicda+/− ES cells, TT2-Aicda−/− ES cells, TT2 ES cells (maintained in our laboratory), and TT2 ES cells (purchased from a distributor) genomes. U, uncut; C, cut. Blue and red triangles indicate the bands from cut wild-type and mutant aida alleles, respectively. Representative data of more than three independent experiments are shown. (E) Schematic representations of wild-type and aida mutant LAG-3 proteins are shown. LAG-3 is composed of the extracellular region with four immunoglobulin-like domains, transmembrane region, and cytoplasmic region. (F) Predicted amino acid sequence of the aida mutant LAG-3 is shown in relation to the first immunoglobulin domain of wild-type LAG-3. A predicted signal sequence is boxed. Dashes represent no difference between the aida and wild-type LAG-3. Asterisk represents a premature stop codon. Cysteine residues involved in the immunoglobulin fold are marked by black dots. (G) Splenocytes from indicated mice were stimulated with 3 µg/ml of plate-bound anti-CD3 Abs for 24 h, and the expression of LAG-3 was analyzed by flow cytometry. Left dot plots are gated on CD4+ cells and right dot plots are gated on CD8+ cells. Representative flow cytometric profiles of three independent experiments are shown.
Figure 4.
Figure 4.
LAG-3 deficiency causes the autoimmunity in aida mice. (A) Survival curves of BALB/c-Pdcd1−/−Lag3aida/aida (n = 13), BALB/c-Pdcd1−/−Lag3+/aida (n = 14), and BALB/c-Pdcd1−/− (n = 6) mice. (B) Type 1 diabetes incidence in NOD-Lag3aida/aida, NOD-Lag3+/aida, and NOD wild-type female (n = 12, 20, and 22, respectively) and male (n = 14, 38, and 16, respectively) mice. (C) Survival curves of BALB/c-Pdcd1−/−Lag3−/− (n = 5), BALB/c-Pdcd1−/−Lag3aida/− (n = 7), and BALB/c-Pdcd1−/−Lag3aida/aida (n = 3) mice. (D) Representative histology of the heart from BALB/c-Pdcd1−/−Lag3aida/aida, BALB/c-Pdcd1−/−Lag3aida/−, and BALB/c-Pdcd1−/−Lag3−/− mice. (E) Type 1 diabetes incidence in NOD-Lag3−/−, NOD-Lag3+/−, and NOD wild-type female (n = 15, 25, and 11, respectively) and male (n = 17, 38, and 18, respectively) mice. (F) Percentage of islets with each grade of insulitis (0, 1, 2, and 3) in 8-wk-old female NOD mice with the indicated genotype. More than 100 islets from five Lag3−/−, three Lag3+/−, and four wild-type mice were analyzed.
Figure 5.
Figure 5.
Hyperplasia of ILFs is dependent on AID deficiency but not on LAG-3 deficiency. (A) Representative pictures of the ILFs in BALB/c wild-type, BALB/c-Aicda−/−, and BALB/c-Lag3aida/aida mice. Arrows indicate ILFs. (B) The number of total (left) and large (right, >0.5 mm) ILFs was evaluated in mice with the indicated genotype at ∼21–23 wk of age (n = 6 each). Each black symbol represents an individual mouse and the red bar represents the mean value for each group. *, P < 0.05.
Figure 6.
Figure 6.
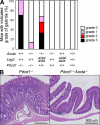
Gastritis in BALB/c-Pdcd1−/− mice requires autoAbs that have undergone SHM and/or CSR. (A) Incidence of gastritis of indicated grade (0, 1, 2, and 3) at 21–23 wk of age in BALB/c-Pdcd1−/− (n = 10), BALB/c-Aicda−/−Pdcd1−/− (n = 7), BALB/c-Aicda−/−Lag3aida/aida (n = 9), BALB/c-Aicda−/− (n = 6), BALB/c-Lag3aida/aida (n = 6), and BALB/c wild-type (n = 5) mice. (B) Representative histology of the stomach of BALB/c-Pdcd1−/− and BALB/c-Pdcd1−/−Aicda−/− mice.
Figure 7.
Figure 7.
Augmented Th1-response in BALB/c-Pdcd1−/−Lag3aida/aida mice. (A and B) The absolute number (A) and frequency (B) of each cell fraction in spleen of mice of indicated genotypes at 3–6 wk of age. (C and D) Frequencies of activated (CD62LCD44+) and naive (CD62L+CD44) CD4+ and CD8+ T cells in spleen of mice of indicated genotypes. (E) Frequencies of indicated cell fraction in CD45+ heart infiltrates from BALB/c-Pdcd1−/−Lag3−/− mice are shown. (F and G) Frequencies of CD4+ and CD8+ T cells that produced IFN-γ, IL-4, and IL-17 upon ex vivo stimulation. Splenocytes of BALB/c-Pdcd1+/−Lag3+/− and BALB/c-Pdcd1−/−Lag3−/− mice and heart infiltrates of BALB/c-Pdcd1−/−Lag3−/− mice were analyzed. Representative flow cytometric profiles are shown in G. (H) Quantities of mRNA encoding indicated genes in inflamed hearts of BALB/c-Pdcd1−/−Lag3aida/aida mice relative to that in spleens of BALB/c wild-type mice. Data are mean ± SEM (A–F) or mean + SEM (H). N.D., not detected. **, P < 0.01; *, P < 0.05. At least three mice of each genotype were analyzed in each experiment. Data of three BALB/c-Pdcd1−/−Lag3aida/aida and seven BALB/c-Pdcd1−/−Lag3−/− mice are combined in A–C.
Figure 8.
Figure 8.
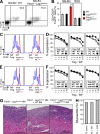
T reg cells were normal in BALB/c-Pdcd1−/−Lag3aida/aida mice. (A and B) Frequencies of CD25+FoxP3+ T cells among CD4+ T cells in spleen of wild-type (n = 9 and 9 for BALB/c and NOD, respectively), Lag3aida/aida (n = 6 and 9 for BALB/c and NOD, respectively), and Pdcd1−/−Lag3−/− (n = 10; seven BALB/c-Pdcd1−/−Lag3−/− and three BALB/c-Pdcd1−/−Lag3aida/aida) mice. Representative flow cytometric profiles are shown in A. Data are mean ± SEM. **, P < 0.01. (C–F) In vitro suppressor assay using CD4+CD25+ T reg cells and CFSE-labeled CD4+CD25 effector cells (Teffs) from mice with the indicated genotype. The numbers on the x-axis indicate the ratio of CD4+CD25+ T reg cells to CD4+CD25 effector T cells. WT, BALB/c wild-type; PL, BALB/c-Pdcd1−/−Lag3aida/aida; aida, BALB/c-Lag3aida/aida mice. Representative flow cytometric profiles of CFSE dilution (C and E). Mean ± SD of triplicate cultures are shown (D and F). Representative data of four (C and D) and two (E and F) independent experiments are shown. (G and H) Myocarditis in BALB/c-Rag2−/− mice reconstituted with BM from BALB/c-Pdcd1−/−Lag3aida/aida and/or BALB/c wild-type mice. The frequency of myocarditis (H) and representative histology (G) are shown for BALB/c-Rag2−/− mice reconstituted with BM cells from BALB/c-Pdcd1−/−Lag3aida/aida mice (n = 11), mixed BM cells from BALB/c-Pdcd1−/−Lag3aida/aida and wild—type mice (n = 11), and mixed BM cells from BALB/c-Pdcd1−/−Lag3aida/aida and BALB/c-Lag3aida/aida mice (n = 6).
Figure 9.
Figure 9.
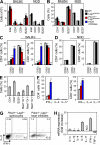
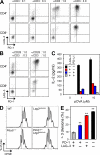
LAG-3 and PD-1 act synergistically to suppress CD4+ T cell activation. (A and B) Splenocytes were stimulated with the indicated concentrations (µg/ml) of plate-bound anti-CD3 Ab in the absence (A) or presence (B) of soluble anti-CD28 Ab for 48 h, and the expression of LAG-3 and PD-1 was analyzed by flow cytometry. Plots are gated on CD4+ or CD8+ cells where indicated. Representative data from two independent experiments are shown. (C) DO11.10 cells transduced or not with LAG-3–expressing retrovirus, were stimulated with OVA peptide–pulsed IIA1.6 cells, transduced or not with PD-L1–expressing retrovirus. T cell IL-2 production was measured by ELISA. Data are the mean ± SEM of duplicate wells. Representative data of two independent experiments are shown. (D and E) Naive CD4+ T cells were sorted from DO11.10 TCR transgenic mice lacking PD-1, LAG-3, or both. Cells were labeled with CFSE and stimulated with IIA1.6–PD-L1 cells pulsed with 0.3 µM OVA peptide. After 2 d, cells were analyzed by flow cytometry. Representative CFSE dilution profiles are shown in D. The frequency of cells with more than three divisions was compared among four genotypes (E). Data are mean ± SEM of triplicate wells. Representative data of two independent experiments are shown. **, P < 0.01 compared with the other three groups.

Similar articles

Cited by

References

    1. Akashi T., Nagafuchi S., Anzai K., Kondo S., Kitamura D., Wakana S., Ono J., Kikuchi M., Niho Y., Watanabe T. 1997. Direct evidence for the contribution of B cells to the progression of insulitis and the development of diabetes in non-obese diabetic mice. Int. Immunol. 9:1159–1164 10.1093/intimm/9.8.1159 - DOI - PubMed
    1. Bachmann M.F., Köhler G., Ecabert B., Mak T.W., Kopf M. 1999. Cutting edge: lymphoproliferative disease in the absence of CTLA-4 is not T cell autonomous. J. Immunol. 163:1128–1131 - PubMed
    1. Baixeras E., Huard B., Miossec C., Jitsukawa S., Martin M., Hercend T., Auffray C., Triebel F., Piatier-Tonneau D. 1992. Characterization of the lymphocyte activation gene 3–encoded protein. A new ligand for human leukocyte antigen class II antigens. J. Exp. Med. 176:327–337 10.1084/jem.176.2.327 - DOI - PMC - PubMed
    1. Blackburn S.D., Shin H., Haining W.N., Zou T., Workman C.J., Polley A., Betts M.R., Freeman G.J., Vignali D.A., Wherry E.J. 2009. Coregulation of CD8+ T cell exhaustion by multiple inhibitory receptors during chronic viral infection. Nat. Immunol. 10:29–37 10.1038/ni.1679 - DOI - PMC - PubMed
    1. Brunkow M.E., Jeffery E.W., Hjerrild K.A., Paeper B., Clark L.B., Yasayko S.A., Wilkinson J.E., Galas D., Ziegler S.F., Ramsdell F. 2001. Disruption of a new forkhead/winged-helix protein, scurfin, results in the fatal lymphoproliferative disorder of the scurfy mouse. Nat. Genet. 27:68–73 10.1038/83784 - DOI - PubMed

Publication types

MeSH terms