. 2011 Feb 14;208(2):327-39.
doi: 10.1084/jem.20102010. Epub 2011 Feb 7.

CXCR7 influences leukocyte entry into the CNS parenchyma by controlling abluminal CXCL12 abundance during autoimmunity

Affiliations

CXCR7 influences leukocyte entry into the CNS parenchyma by controlling abluminal CXCL12 abundance during autoimmunity

Lillian Cruz-Orengo et al. J Exp Med. .

Abstract

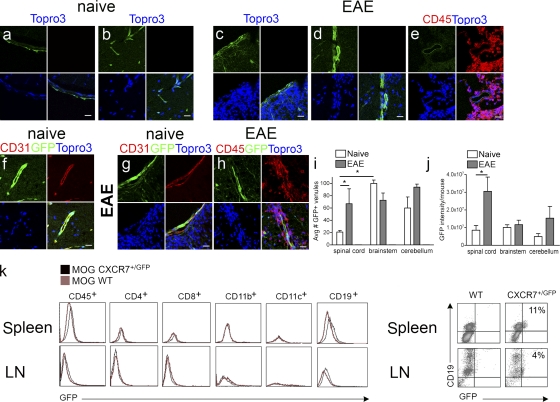
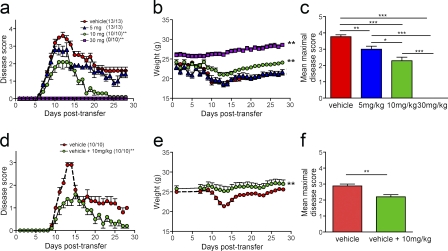
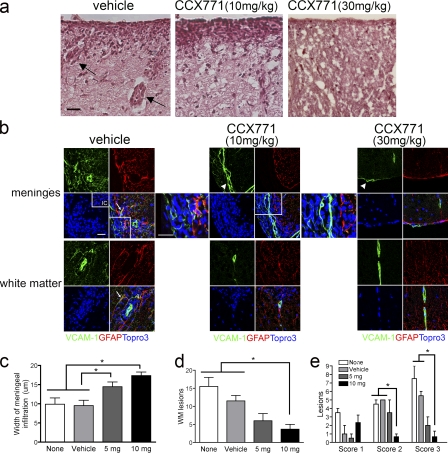
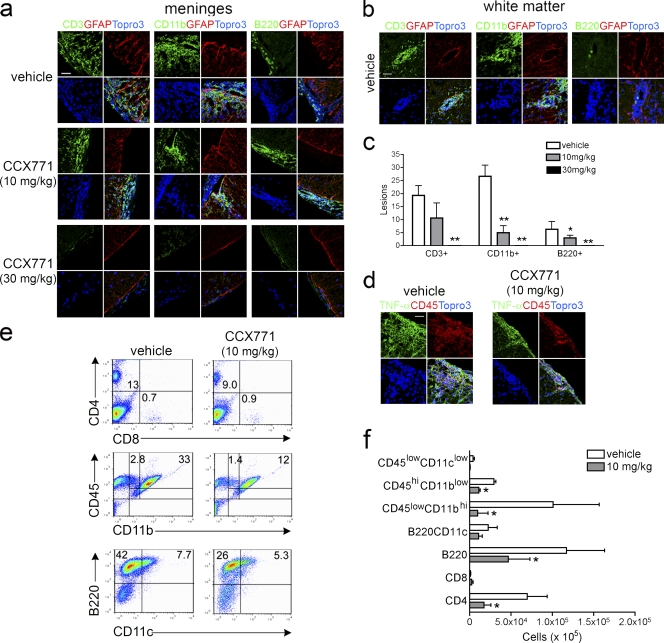
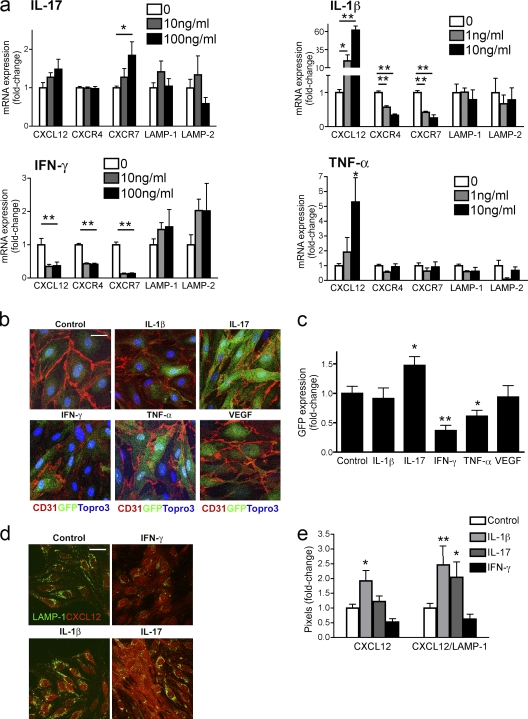
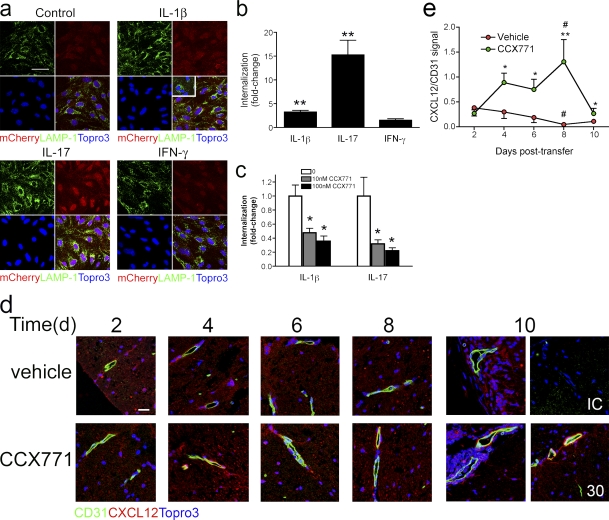
Loss of CXCL12, a leukocyte localizing cue, from abluminal surfaces of the blood-brain barrier occurs in multiple sclerosis (MS) lesions. However, the mechanisms and consequences of reduced abluminal CXCL12 abundance remain unclear. Here, we show that activation of CXCR7, which scavenges CXCL12, is essential for leukocyte entry via endothelial barriers into the central nervous system (CNS) parenchyma during experimental autoimmune encephalomyelitis (EAE), a model for MS. CXCR7 expression on endothelial barriers increased during EAE at sites of inflammatory infiltration. Treatment with a CXCR7 antagonist ameliorated EAE, reduced leukocyte infiltration into the CNS parenchyma and parenchymal VCAM-1 expression, and increased abluminal levels of CXCL12. Interleukin 17 and interleukin 1β increased, whereas interferon-γ decreased, CXCR7 expression on and CXCL12 internalization in primary brain endothelial cells in vitro. These findings identify molecular requirements for the transvascular entry of leukocytes into the CNS and suggest that CXCR7 blockade may have therapeutic utility for the treatment of MS.


Figures

Figure 1.
Figure 1.
CXCR7 is expressed by endothelial cells within the CNS and B cells within lymphoid tissues. Spinal cord sections derived from naive CXCR7GFP/+ mice (a, b, and f) and from those with EAE (c–e, g, and h) were evaluated via confocal microscopy for GFP fluorescence alone (green; a–d) or with expression of CD45 (red; e) and, after amplification with anti-GFP antibodies, in conjunction with detection of CD31 (f and g) and CD45 (h). All nuclei are counterstained with ToPro3 (blue). Bars, 25 µm. Quantitation of mean numbers of GFP+ venules (i) and mean GFP levels (j) in spinal cord (SC), brainstem (BS), and cerebella (CB) of naive or EAE CXCR7GFP/+ mice are shown. Data are expressed as the mean intensity per vessel for n = 12 images taken from 3 mice/group. *, P < 0.01. Flow cytometric analysis of expression of GFP and leukocyte markers in cells derived from spleens (top) and lymph nodes (LNs, bottom) of MOG-immunized wild-type (red lines) and CXCR7GFP/+ (black lines) mice (k). (l) Spleen and LN cells were stained with indicated antibodies; numbers indicate percentages of CD19+ cells expression GFP. Data are representative of two experiments with three mice per group.
Figure 2.
Figure 2.
CXCR7 antagonism decreases the clinical severity of EAE. Mice were intravenously injected with 10 × 106 MOG-specific CD4+ T cells, and dose response effects of CCX771 on disease induction (a–c) and treatment of ongoing disease (d–f) were examined. For dose-response curves evaluating clinical disease severity and weight loss (a and b), animals were grouped into those receiving vehicle or CCX771 at indicated doses daily, beginning at the time of adoptive transfer of MOG-specific CD4+ T cells. Mice were monitored daily, weighed, and graded on a scale of 0–5, as described previously (McCandless et al., 2009). Numbers in parentheses indicated number of mice with disease compared with total mice in each group. Results are expressed as mean disease scores ± SEM, and curves were analyzed using one-way ANOVA compared with vehicle–treated mice. **, P < 0.001. (c) Mean maximal disease severity scores for animals treated with vehicle or CCX771 at indicated doses. *, P < 0.05; **, P < 0.01; ***, P < 0.001. To determine whether CCX771 ameliorates ongoing EAE and weight loss (d and e), animals were grouped into those receiving vehicle or vehicle until animals reached a score of 1 and then CCX771 at 10 mg/kg. Results are expressed as mean disease scores ± SEM and analyzed via one-way ANOVA. **, P < 0.001. (f) Mean maximal disease severity scores for animals treated with vehicle or with vehicle until development of disease and then CCX771 at 10 mg/kg. **, P < 0.01. Data are representative of five experiments with n = 10–13 animals per group.
Figure 3.
Figure 3.
CXCR7 antagonism prevents leukocyte entry at the microvasculature. (a) Histological analyses of spinal cord tissues from vehicle- and CCX771-treated (10 or 30 mg/kg) mice 12 d after MOG-specific CD4+ T cell transfer. Note perivascular cuffs in vehicle treated tissue section (arrows). Bars, 25 µm. (b) IHC and confocal imaging detection of GFAP (red) and VCAM-1 (green) within meninges (top images) and white matter (bottom images) of animals with EAE treated with vehicle (left) versus CCX771 at 10 or 30 mg/kg. Nuclei were counterstained with ToPro3 (blue). (inset) Isotype control (IC). Higher magnification images of boxed areas on lower power images of meninges from mice treated with vehicle and 10 mg/kg CCX771 are provided to the right of merged images. Note the lack of astrocyte but not meningeal (arrowheads) expression of VCAM-1 in CCX771-treated tissues. Analyses were performed on spinal cords harvested from three animals per group at peak of disease. Bars, 25 µm. Quantitation of meningeal width (c), lesion number (d), and lesion characteristics (e) in mice from four treatment groups: none (white bars), vehicle (light gray bars), CCX771 at 5 mg/kg (dark gray bars), and 10 mg/kg (black bars). Scoring of perivascular cuffs: 1 = 2–6 cells; 2 = 6–11 cells; 3 > 11 cells. n = 5 mice/group; data expressed as mean width (millimeters; c), number of white matter (WM) lesions (d), or number of lesions of each score (e) ± SEM. *, P < 0.05.
Figure 4.
Figure 4.
CXCR7 antagonism limits leukocyte trafficking to the CNS. IHC analyses of infiltrating leukocytes expressing CD3, CD11b, or B220 in respect to activated astrocytes (red, GFAP) within the meninges (a) and white matter (b) of vehicle-treated versus CCX771-treated (10 or 30 mg/kg) mice with EAE. Nuclei were counterstained with ToPro3 (blue). Bar, 10 µm. Analyses were performed on spinal cords harvested from three animals per group at peak of disease. (c) Quantitative analysis of numbers of white matter lesions attributed to the infiltration of CD3+, CD11b+, and B220+ cells within spinal cord tissues of vehicle-treated and CCX771-treated (10 or 30 mg/kg) mice with EAE. Data are presented as the mean numbers of lesions in n = 3 mice per group ± SEM. (d) IHC analysis of infiltrating leukocytes (red, CD45) in respect to TNF expression (green) in spinal cords of vehicle-treated versus CCX771-treated (10 mg/kg) mice with EAE. Nuclei were counterstained with ToPro3 (blue). Bar, 25 µm. (e and f) Flow cytometric analysis of percentages (e, numbers in quadrants) and total cell numbers (f) of CD4+, CD8+, CD45+, CD11b+, CD11c+, and B220+ leukocytes harvested from spinal cords of vehicle-treated versus CCX771-treated (10 mg/kg) mice. Data depicting total cell numbers are presented as the mean numbers of cells derived from spinal cords of vehicle-treated versus CCX771-treated mice with EAE ± SEM from three experiments with five mice per group. *, P < 0.05; **, P < 0.01.
Figure 5.
Figure 5.
CXCR7 expression and CXCL12 internalization are altered by T cell cytokines. (a) Primary BMECs were treated with indicated doses of IL-17, IL-1β, IFN-γ, and TNF, and expression of CXCL12, CXCR4, CXCR7, LAMP-1, and LAMP-2 mRNA were measured via QPCR. Data from three experiments with triplicates are presented as the mean fold change in mRNA levels over untreated controls ± SEM. *, P < 0.05; **, P < 0.001. (b) BMECs derived from CXCR7GFP/+ mice were treated with cytokines (IL-1β, IL-17, IFN-γ, and TNF) or VEGF (100 ng/ml) or left untreated (control), and CD31 (red) and GFP (green) expression was evaluated. Nuclei counterstained with ToPro3 (blue). Bar, 10 µm. (c) Quantitative analysis of GFP expression in cytokine- or VEGF-treated CD31+ CXCR7GFP/+BMECs. Data from three experiments performed in triplicate and presented as the mean fold change in GFP expression over untreated BMECs ± SEM. *, P < 0.05; **, P < 0.001. (d) LAMP-1 (green) and CXCL12 (red) colocalization in BMECs left untreated (control) or treated with IFN-γ, IL-1β, and IL-17. Bar, 10 µm. (e) Quantitation of CXCL12 and colocalization of CXCL12 and LAMP-1 staining in control and IL-1β–, IL-17–, and IFN-γ–treated BMECs. Data from three experiments in which five images were analyzed in each of three replicates per treatment group and presented as mean fold change over untreated controls. *, P < 0.05; **, P < 0.001.
Figure 6.
Figure 6.
BMEC internalization of CXCL12 is mediated by CXCR7. (a) BMECs were left untreated (control) or treated overnight with IL-1β (10 ng/ml), IL-17 (100 ng/ml), or IFN-γ (100 ng/ml) and internalization of CXCL12-Cherry (red, L12mCherry; left) versus mCherry alone (inset) via colocalization with LAMP-1 (green). Nuclei were counterstained with ToPro3 (blue) Magnification 40×. Bar, 20 µm. (b) Fold changes in internalization of CXCL12-Cherry in BMECs treated with IL-1β (10 ng/ml), IL-17 (100 ng/ml), or IFN-γ (100 ng/ml) over those left untreated. (c) Fold changes in internalization of CXCL12-Cherry in IL-1β– and IL-17–treated BMECs left unexposed or exposed to 10 nM or 100 nM (filled bars) CCX771. All quantitative data are presented as mean ± SEM for an experiment done in triplicate, and are representative of three to four experiments. **, P < 0.001; *, P < 0.05. (d) Detection of CD31 (green) and CXCL12 (red) within spinal cords of mice treated with vehicle or CCX771 (10 mg/kg for all bottom panels except for the far right panel, which is from a mouse treated with 30 mg/kg) at 2, 4, 6, 8, and 10 d after transfer of MOG-specific CD4+ T cells. Nuclei have been counterstained with Topro3 (blue). Bar, 20 µm. IC, isotype control. Data are representative of 10 images each from 3 mice per treatment group per time point. (e) Quantitative analysis of CXCL12 expression on CD31+ venules within the spinal cords of mice at various days after transfer of MOG-specific T cells. Data derived from venules analyzed within four to eight images per spinal cord for three mice per treatment group for each time point, and are expressed as the mean ratios of signal intensity of CXCL12/CD31 ± SEM. **, P < 0.001 and *, P < 0.05 for comparisons between treatment groups on the same day after transfer; #, P < 0.05 for comparisons between days 2 and 8 after transfer within a treatment group.

References

    1. Abbott N.J., Rönnbäck L., Hansson E. 2006. Astrocyte-endothelial interactions at the blood-brain barrier. Nat. Rev. Neurosci. 7:41–53 10.1038/nrn1824 - DOI - PubMed
    1. Afonso P.V., Ozden S., Prevost M.C., Schmitt C., Seilhean D., Weksler B., Couraud P.O., Gessain A., Romero I.A., Ceccaldi P.E. 2007. Human blood-brain barrier disruption by retroviral-infected lymphocytes: role of myosin light chain kinase in endothelial tight-junction disorganization. J. Immunol. 179:2576–2583 - PubMed
    1. Argaw A.T., Zhang Y., Snyder B.J., Zhao M.L., Kopp N., Lee S.C., Raine C.S., Brosnan C.F., John G.R. 2006. IL-1beta regulates blood-brain barrier permeability via reactivation of the hypoxia-angiogenesis program. J. Immunol. 177:5574–5584 - PubMed
    1. Axtell R.C., de Jong B.A., Boniface K., van der Voort L.F., Bhat R., De Sarno P., Naves R., Han M., Zhong F., Castellanos J.G., et al. 2010. T helper type 1 and 17 cells determine efficacy of interferon-beta in multiple sclerosis and experimental encephalomyelitis. Nat. Med. 16:406–412 10.1038/nm.2110 - DOI - PMC - PubMed
    1. Baron J.L., Madri J.A., Ruddle N.H., Hashim G., Janeway C.A., Jr 1993. Surface expression of alpha 4 integrin by CD4 T cells is required for their entry into brain parenchyma. J. Exp. Med. 177:57–68 10.1084/jem.177.1.57 - DOI - PMC - PubMed

Publication types

MeSH terms