

Correction of breathing-induced errors in magnetic resonance thermometry of hyperthermia using multiecho field fitting techniques
- PMID: 21302786
- PMCID: PMC3000859
- DOI: 10.1118/1.3515462
Correction of breathing-induced errors in magnetic resonance thermometry of hyperthermia using multiecho field fitting techniques
Abstract
Purpose: Breathing motion can create large errors when performing magnetic resonance (MR) thermometry of the breast. Breath holds can be used to minimize these errors, but not eliminate them. Between breath holds, the referenceless method can be used to further reduce errors by relying on regions of nonheated fatty tissue surrounding the heated region. When the surrounding tissue is heated (i.e., for a hyperthermia treatment), errors can result due to phase changes of the small amounts of water in the tissue. Therefore, an extension of the referenceless method is proposed which fits for the field in fatty tissue independent of temperature change and extrapolates it to the water-rich regions.
Methods: Nonheating experiments were performed with male volunteers performing breath holds on top of a phantom mimicking a breast with a tumor. Heating experiments were also conducted with the same phantom while mechanically simulated breath holds were performed. A nonheating experiment was also performed with a healthy female breast. For each experiment, a nonlinear fitting algorithm was used to fit for temperature change and B0 field inside of the fatty tissue. The field changes were then extrapolated into water-rich (tumor) portions of the image using a least-squares fit to a fifth-order equation, to correct for field changes due to breath hold changes. Similar results were calculated using the image phase, to mimic the use of the referenceless method.
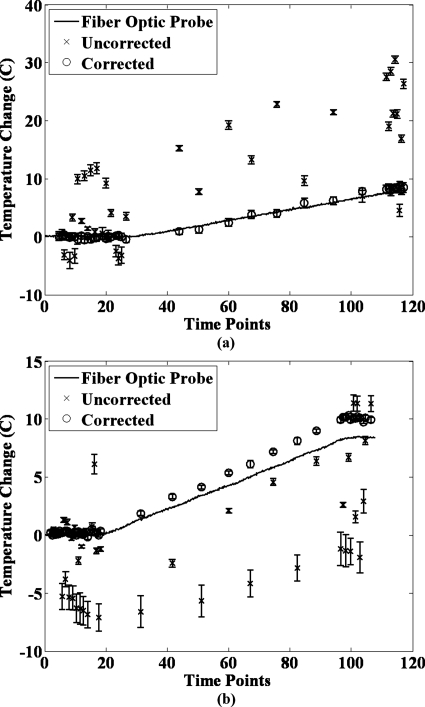
Results: Phantom results showed large reduction of mean error and standard deviation. In the non-heating experiments, the traditional referenceless method and our extended method both corrected by similar amounts. However, in the heating experiments, the average deviation of the temperature calculated with the extended method from a fiber optic probe temperature was approximately 50% less than the deviation with the referenceless method. The in vivo breast results demonstrated reduced standard deviation and mean.
Conclusions: In this paper, we have developed an extension of the referenceless method to correct for breathing errors using multiecho fitting methods to fit for the B0 field in the fatty tissue and using measured field changes as references to extrapolate field corrections into a water-only (tumor) region. This technique has been validated in a number of situations, and in all cases, the correction method has been shown to greatly reduce temperature error in water-rich regions. The method has also been shown to be an improvement over similar methods that use image phase changes instead of field changes, particularly when temperature changes are induced.
Figures


Similar articles
-
Anatomical Phase Extraction (APE) Method: A Novel Method to Correct Detrimental Effects of Tissue-Inhomogeneity in Referenceless MR Thermometry-Preliminary Ex Vivo Investigation.Comput Math Methods Med. 2021 Aug 10;2021:5566775. doi: 10.1155/2021/5566775. eCollection 2021. Comput Math Methods Med. 2021. PMID: 34422091 Free PMC article.
-
Hybrid referenceless and multibaseline subtraction MR thermometry for monitoring thermal therapies in moving organs.Med Phys. 2010 Sep;37(9):5014-26. doi: 10.1118/1.3475943. Med Phys. 2010. PMID: 20964221 Free PMC article.
-
Referenceless magnetic resonance temperature imaging using Gaussian process modeling.Med Phys. 2017 Jul;44(7):3545-3555. doi: 10.1002/mp.12231. Epub 2017 Jun 1. Med Phys. 2017. PMID: 28317125
-
Temperature-induced tissue susceptibility changes lead to significant temperature errors in PRFS-based MR thermometry during thermal interventions.Magn Reson Med. 2010 Nov;64(5):1360-72. doi: 10.1002/mrm.22531. Magn Reson Med. 2010. PMID: 20648685
-
Temperature Monitoring in Hyperthermia Treatments of Bone Tumors: State-of-the-Art and Future Challenges.Sensors (Basel). 2021 Aug 13;21(16):5470. doi: 10.3390/s21165470. Sensors (Basel). 2021. PMID: 34450911 Free PMC article. Review.
Cited by
-
Technical advances in motion-robust MR thermometry.Magn Reson Med. 2024 Jul;92(1):15-27. doi: 10.1002/mrm.30057. Epub 2024 Mar 19. Magn Reson Med. 2024. PMID: 38501903 Free PMC article. Review.
-
Quality of MR thermometry during palliative MR-guided high-intensity focused ultrasound (MR-HIFU) treatment of bone metastases.J Ther Ultrasound. 2015 Mar 24;3:5. doi: 10.1186/s40349-015-0026-7. eCollection 2015. J Ther Ultrasound. 2015. PMID: 25874113 Free PMC article.
-
Comprehensive analysis of the Cramer-Rao bounds for magnetic resonance temperature change measurement in fat-water voxels using multi-echo imaging.MAGMA. 2012 Feb;25(1):49-61. doi: 10.1007/s10334-011-0247-x. Epub 2011 Mar 27. MAGMA. 2012. PMID: 21442434 Free PMC article.
-
Heat Modulation of Intrinsic MR Contrasts for Tumor Characterization.Cancers (Basel). 2022 Jan 14;14(2):405. doi: 10.3390/cancers14020405. Cancers (Basel). 2022. PMID: 35053567 Free PMC article.
-
Anatomical Phase Extraction (APE) Method: A Novel Method to Correct Detrimental Effects of Tissue-Inhomogeneity in Referenceless MR Thermometry-Preliminary Ex Vivo Investigation.Comput Math Methods Med. 2021 Aug 10;2021:5566775. doi: 10.1155/2021/5566775. eCollection 2021. Comput Math Methods Med. 2021. PMID: 34422091 Free PMC article.
References
-
- Dewhirst M., Jones E., Samulski R. J., Vujaskovic Z., Li C., and Prosnitz L., in Cancer Medicine 6, edited by Kufe D. W.et al. (BC Decker, Hamilton, 2003), pp. 623–636.
Publication types
MeSH terms
Grants and funding
LinkOut - more resources
Full Text Sources
Medical
