. 2011 Feb 8:5:26.
doi: 10.1186/1752-0509-5-26.

Integration of lipidomics and transcriptomics data towards a systems biology model of sphingolipid metabolism

Affiliations

Integration of lipidomics and transcriptomics data towards a systems biology model of sphingolipid metabolism

Shakti Gupta et al. BMC Syst Biol. .

Abstract

Background: Sphingolipids play important roles in cell structure and function as well as in the pathophysiology of many diseases. Many of the intermediates of sphingolipid biosynthesis are highly bioactive and sometimes have antagonistic activities, for example, ceramide promotes apoptosis whereas sphingosine-1-phosphate can inhibit apoptosis and induce cell growth; therefore, quantification of the metabolites and modeling of the sphingolipid network is imperative for an understanding of sphingolipid biology.

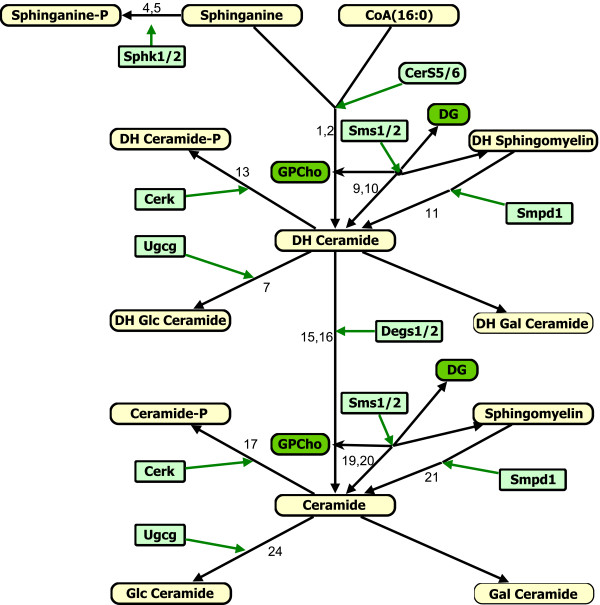
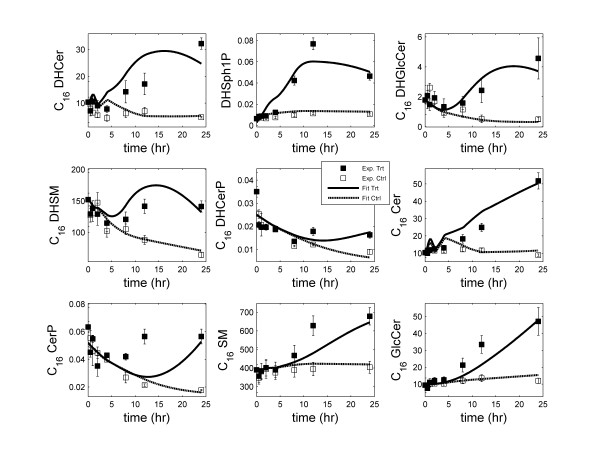
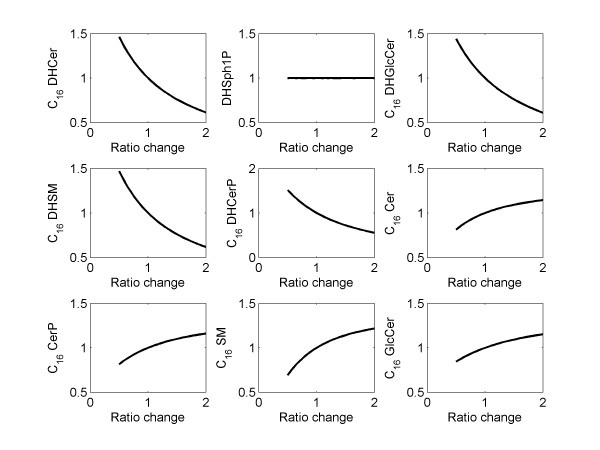
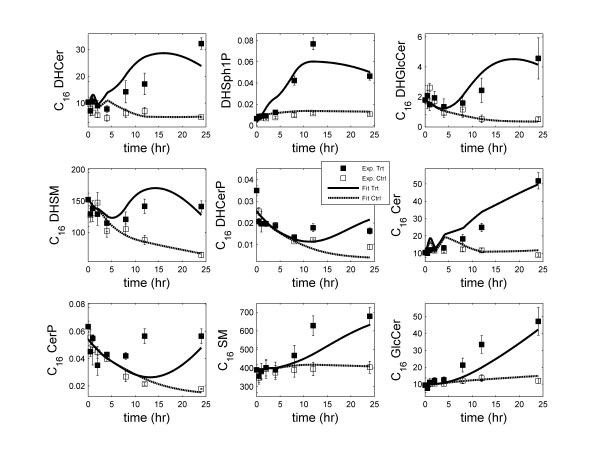
Results: In this direction, the LIPID MAPS Consortium is developing methods to quantitate the sphingolipid metabolites in mammalian cells and is investigating their application to studies of the activation of the RAW264.7 macrophage cell by a chemically defined endotoxin, Kdo2-Lipid A. Herein, we describe a model for the C16-branch of sphingolipid metabolism (i.e., for ceramides with palmitate as the N-acyl-linked fatty acid, which is selected because it is a major subspecies for all categories of complex sphingolipids in RAW264.7 cells) integrating lipidomics and transcriptomics data and using a two-step matrix-based approach to estimate the rate constants from experimental data. The rate constants obtained from the first step are further refined using generalized constrained nonlinear optimization. The resulting model fits the experimental data for all species. The robustness of the model is validated through parametric sensitivity analysis.

Conclusions: A quantitative model of the sphigolipid pathway is developed by integrating metabolomics and transcriptomics data with legacy knowledge. The model could be used to design experimental studies of how genetic and pharmacological perturbations alter the flux through this important lipid biosynthetic pathway.


Figures

Figure 1
Figure 1
Kdo2-Lipid A (KLA) stimulated sphingolipid metabolism pathway. The numbers above (or near) the arrows are reaction numbers (Table 1). The default degradation reactions are not labeled. Metabolites and enzymes are represented as rectangular boxes with round corner and rectangular boxes, respectively. The measured and unmeasured metabolites that are and are not present in detectable amounts are differentiated by thick and thin borders, respectively. For full name of metabolites, see the list of abbreviations, presented at the end of the manuscript.
Figure 2
Figure 2
Simulation results of kinetic modeling of sphingolipids network: Fit of the predicted response (control and treatment with KLA) to the corresponding experimental data. In the legend, 'Ctrl' refers to control and 'Trt' refers to KLA treatment of RAW 264.7 cells. The error-bars shown on the experimental data are standard-error of mean.
Figure 3
Figure 3
Simulation results of parametric sensitivity analysis for the parameter kf16 (C16 DHCer → C16 Cer). X-axis: ratio of perturbed value of the parameter to the original (optimized) value of the parameter; Y-axis: fold-change in the maximum-value of state variables (metabolites).
Figure 4
Figure 4
Chemical structure of (a) C16 Cer and (b) C16 DHCer.
Figure 5
Figure 5
Simulation results of kinetic modeling of sphingolipids network where parameters for CerK, Ugcg and SMS1/2 are same for the reactions involving Cer and DHCer: Fit of the predicted response (control and treatment with KLA) to the corresponding experimental data. In the legend, 'Ctrl' refers to control and 'Trt' refers to KLA treatment of RAW 264.7 cells. The error-bars shown on the experimental data are standard-error of mean.

References

    1. Fahy E, Subramaniam S, Brown HA, Glass CK, Merrill AH, Murphy RC, Raetz CRH, Russell DW, Seyama Y, Shaw W. et al.A comprehensive classification system for lipids. Journal of lipid research. 2005;46(5):839–862. doi: 10.1194/jlr.E400004-JLR200. - DOI - PubMed
    1. Merrill AH, Wang MD, Park M, Sullards MC. (Glyco)sphingolipidology: an amazing challenge and opportunity for systems biology. Trends Biochem Sci. 2007;32(10):457–468. doi: 10.1016/j.tibs.2007.09.004. - DOI - PubMed
    1. Zheng W, Kollmeyer J, Symolon H, Momin A, Munter E, Wang E, Kelly S, Allegood JC, Liu Y, Peng Q. et al.Ceramides and other bioactive sphingolipid backbones in health and disease: lipidomic analysis, metabolism and roles in membrane structure, dynamics, signaling and autophagy. Biochim Biophys Acta. 2006;1758(12):1864–1884. doi: 10.1016/j.bbamem.2006.08.009. - DOI - PubMed
    1. Lopez PH, Schnaar RL. Gangliosides in cell recognition and membrane protein regulation. Curr Opin Struct Biol. 2009;19(5):549–557. doi: 10.1016/j.sbi.2009.06.001. - DOI - PMC - PubMed
    1. Zeidan YH, Hannun YA. Translational aspects of sphingolipid metabolism. Trends Mol Med. 2007;13(8):327–336. doi: 10.1016/j.molmed.2007.06.002. - DOI - PubMed

Publication types