

Multimodal microscopy for automated histologic analysis of prostate cancer
- PMID: 21303560
- PMCID: PMC3045985
- DOI: 10.1186/1471-2407-11-62
Multimodal microscopy for automated histologic analysis of prostate cancer
Abstract
Background: Prostate cancer is the single most prevalent cancer in US men whose gold standard of diagnosis is histologic assessment of biopsies. Manual assessment of stained tissue of all biopsies limits speed and accuracy in clinical practice and research of prostate cancer diagnosis. We sought to develop a fully-automated multimodal microscopy method to distinguish cancerous from non-cancerous tissue samples.
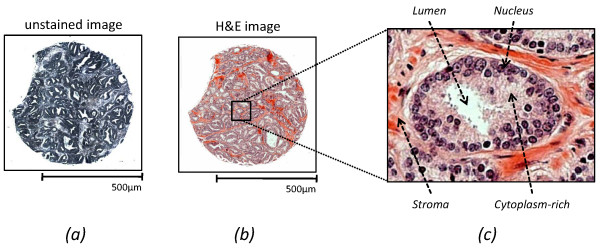
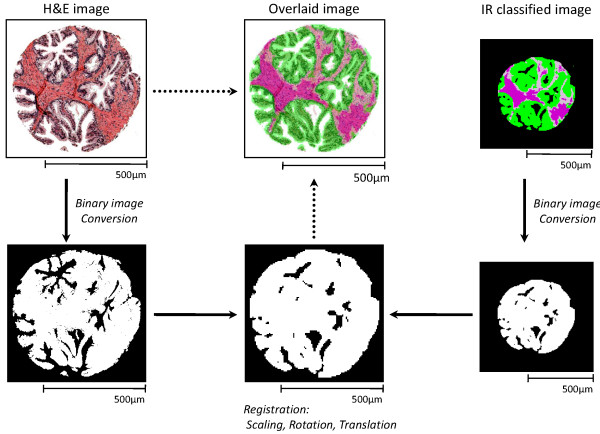
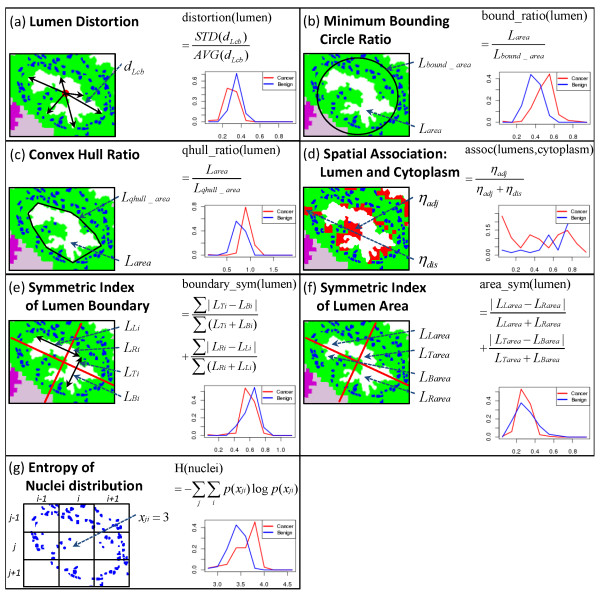
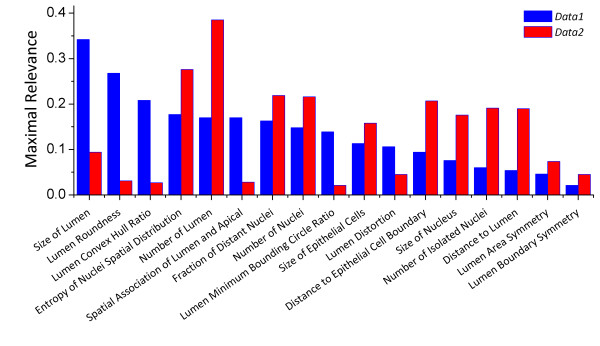
Methods: We recorded chemical data from an unstained tissue microarray (TMA) using Fourier transform infrared (FT-IR) spectroscopic imaging. Using pattern recognition, we identified epithelial cells without user input. We fused the cell type information with the corresponding stained images commonly used in clinical practice. Extracted morphological features, optimized by two-stage feature selection method using a minimum-redundancy-maximal-relevance (mRMR) criterion and sequential floating forward selection (SFFS), were applied to classify tissue samples as cancer or non-cancer.
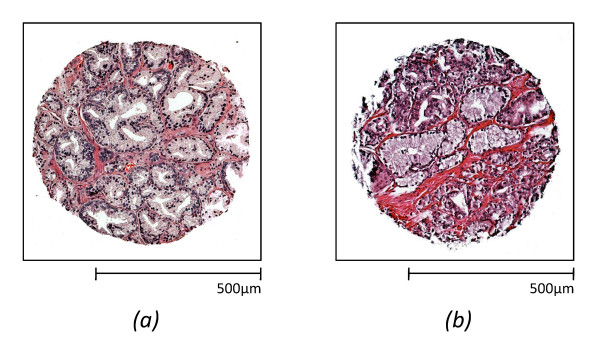
Results: We achieved high accuracy (area under ROC curve (AUC) >0.97) in cross-validations on each of two data sets that were stained under different conditions. When the classifier was trained on one data set and tested on the other data set, an AUC value of ~0.95 was observed. In the absence of IR data, the performance of the same classification system dropped for both data sets and between data sets.
Conclusions: We were able to achieve very effective fusion of the information from two different images that provide very different types of data with different characteristics. The method is entirely transparent to a user and does not involve any adjustment or decision-making based on spectral data. By combining the IR and optical data, we achieved high accurate classification.
Figures


Similar articles
-
High-throughput quantum cascade laser (QCL) spectral histopathology: a practical approach towards clinical translation.Faraday Discuss. 2016 Jun 23;187:135-54. doi: 10.1039/c5fd00176e. Faraday Discuss. 2016. PMID: 27095185
-
Development of a practical spatial-spectral analysis protocol for breast histopathology using Fourier transform infrared spectroscopic imaging.Faraday Discuss. 2016 Jun 23;187:43-68. doi: 10.1039/c5fd00199d. Faraday Discuss. 2016. PMID: 27095431 Free PMC article.
-
Machine learning approaches to analyze histological images of tissues from radical prostatectomies.Comput Med Imaging Graph. 2015 Dec;46 Pt 2(Pt 2):197-208. doi: 10.1016/j.compmedimag.2015.08.002. Epub 2015 Aug 20. Comput Med Imaging Graph. 2015. PMID: 26362074 Free PMC article.
-
Multiparametric MRI in detection and staging of prostate cancer.Dan Med J. 2017 Feb;64(2):B5327. Dan Med J. 2017. PMID: 28157066 Review.
-
High throughput assessment of cells and tissues: Bayesian classification of spectral metrics from infrared vibrational spectroscopic imaging data.Biochim Biophys Acta. 2006 Jul;1758(7):830-45. doi: 10.1016/j.bbamem.2006.05.007. Epub 2006 May 17. Biochim Biophys Acta. 2006. PMID: 16822477 Review.
Cited by
-
Label-Free Infrared Spectral Histology of Skin Tissue Part II: Impact of a Lumican-Derived Peptide on Melanoma Growth.Front Cell Dev Biol. 2020 May 29;8:377. doi: 10.3389/fcell.2020.00377. eCollection 2020. Front Cell Dev Biol. 2020. PMID: 32548117 Free PMC article.
-
Automated prostate tissue referencing for cancer detection and diagnosis.BMC Bioinformatics. 2016 Jun 1;17(1):227. doi: 10.1186/s12859-016-1086-6. BMC Bioinformatics. 2016. PMID: 27247129 Free PMC article.
-
Discrimination of Human Cell Lines by Infrared Spectroscopy and Mathematical Modeling.Iran J Pharm Res. 2015 Summer;14(3):803-10. Iran J Pharm Res. 2015. PMID: 26330868 Free PMC article.
-
Tissue microarrays as a tool in the discovery and validation of predictive biomarkers.Methods Mol Biol. 2012;823:201-14. doi: 10.1007/978-1-60327-216-2_13. Methods Mol Biol. 2012. PMID: 22081347 Free PMC article.
-
Deep learning for FTIR histology: leveraging spatial and spectral features with convolutional neural networks.Analyst. 2019 Feb 25;144(5):1642-1653. doi: 10.1039/c8an01495g. Analyst. 2019. PMID: 30644947 Free PMC article.
References
-
- Jacobsen SJ, Katusic SK, Bergstralh EJ, Oesterling JE, Ohrt D, Klee GG, Chute CG, Lieber MM. Incidence of Prostate-Cancer Diagnosis in the Eras before and after Serum Prostate-Specific Antigen Testing. Jama-Journal of the American Medical Association. 1995;274(18):1445–1449. doi: 10.1001/jama.274.18.1445. - DOI - PubMed
-
- Humphrey PA, American Society for Clinical Pathology. Prostate pathology. Chicago: American Society for Clinical Pathology; 2003.
Publication types
MeSH terms
Grants and funding
LinkOut - more resources
Full Text Sources
Other Literature Sources
Medical
