

Network analysis: applications for the developing brain
- PMID: 21303762
- PMCID: PMC3124081
- DOI: 10.1177/0883073810385345
Network analysis: applications for the developing brain
Abstract
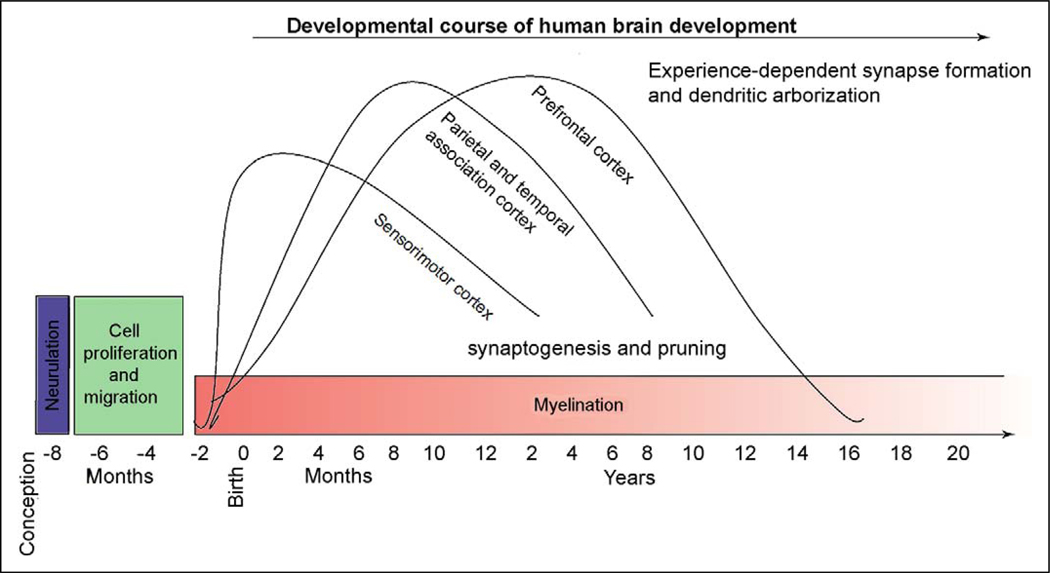
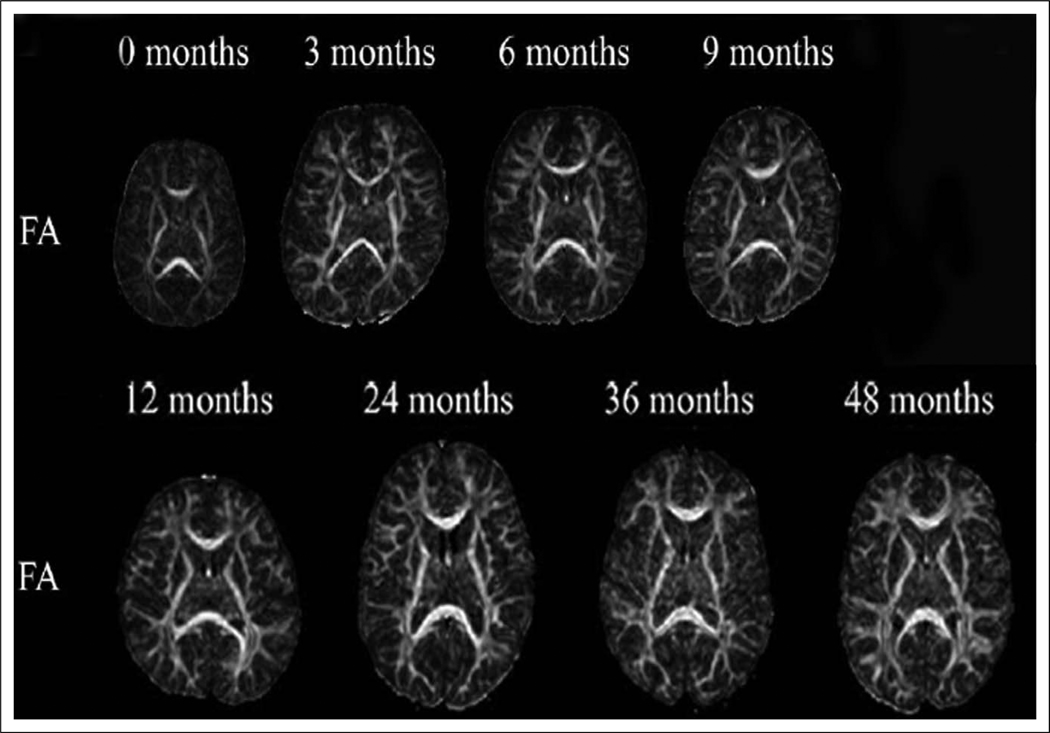
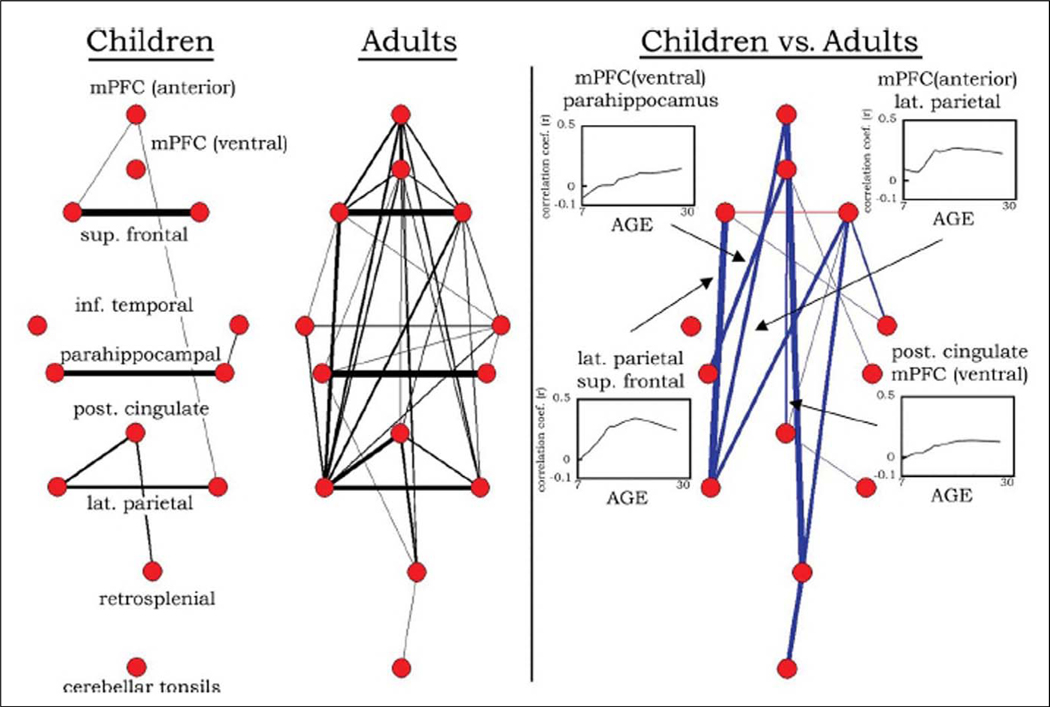
Development of the human brain follows a complex trajectory of age-specific anatomical and physiological changes. The application of network analysis provides an illuminating perspective on the dynamic interregional and global properties of this intricate and complex system. Here, we provide a critical synopsis of methods of network analysis with a focus on developing brain networks. After discussing basic concepts and approaches to network analysis, we explore the primary events of anatomical cortical development from gestation through adolescence. Upon this framework, we describe early work revealing the evolution of age-specific functional brain networks in normal neurodevelopment. Finally, we review how these relationships can be altered in disease and perhaps even rectified with treatment. While this method of description and inquiry remains in early form, there is already substantial evidence that the application of network models and analysis to understanding normal and abnormal human neural development holds tremendous promise for future discovery.
Conflict of interest statement
The authors declared no potential conflicts of interest with respect to the authorship and/or publication of this article.
Figures
Similar articles
-
The development of human functional brain networks.Neuron. 2010 Sep 9;67(5):735-48. doi: 10.1016/j.neuron.2010.08.017. Neuron. 2010. PMID: 20826306 Free PMC article. Review.
-
Contributions and challenges for network models in cognitive neuroscience.Nat Neurosci. 2014 May;17(5):652-60. doi: 10.1038/nn.3690. Epub 2014 Mar 30. Nat Neurosci. 2014. PMID: 24686784 Review.
-
Topological organization of functional brain networks in healthy children: differences in relation to age, sex, and intelligence.PLoS One. 2013;8(2):e55347. doi: 10.1371/journal.pone.0055347. Epub 2013 Feb 4. PLoS One. 2013. PMID: 23390528 Free PMC article.
-
Age-related reorganizational changes in modularity and functional connectivity of human brain networks.Brain Connect. 2014 Nov;4(9):662-76. doi: 10.1089/brain.2014.0286. Epub 2014 Oct 6. Brain Connect. 2014. PMID: 25183440 Free PMC article.
-
Dynamic functional connectivity.Curr Opin Neurobiol. 2007 Apr;17(2):161-70. doi: 10.1016/j.conb.2007.03.008. Epub 2007 Mar 26. Curr Opin Neurobiol. 2007. PMID: 17379500 Review.
Cited by
-
Robust disruptions in electroencephalogram cortical oscillations and large-scale functional networks in autism.BMC Neurol. 2015 Jun 27;15:97. doi: 10.1186/s12883-015-0355-8. BMC Neurol. 2015. PMID: 26111798 Free PMC article.
-
Sensory integration, sensory processing, and sensory modulation disorders: putative functional neuroanatomic underpinnings.Cerebellum. 2011 Dec;10(4):770-92. doi: 10.1007/s12311-011-0288-8. Cerebellum. 2011. PMID: 21630084 Review.
-
Dynamic reconfiguration of structural and functional connectivity across core neurocognitive brain networks with development.J Neurosci. 2011 Dec 14;31(50):18578-89. doi: 10.1523/JNEUROSCI.4465-11.2011. J Neurosci. 2011. PMID: 22171056 Free PMC article.
-
Sleep spindles in the healthy brain from birth through 18 years.Sleep. 2023 Apr 12;46(4):zsad017. doi: 10.1093/sleep/zsad017. Sleep. 2023. PMID: 36719044 Free PMC article.
-
Developmental changes in spontaneous electrocortical activity and network organization from early to late childhood.Neuroimage. 2015 Sep;118:237-47. doi: 10.1016/j.neuroimage.2015.06.013. Epub 2015 Jun 7. Neuroimage. 2015. PMID: 26057595 Free PMC article.
References
-
- Drachman DA. Do we have brain to spare? Neurology. 2005;64:2004–2005. - PubMed
-
- Bullmore E, Sporns O. Complex brain networks: graph theoretical analysis of structural and functional systems. Nat Rev Neurosci. 2009;10:186–198. - PubMed
-
- White J, Southgate E, Thomson, S. Brenner The structure of the nervous system of the nematode Caenorhabditis elegans. Philos Trans R Soc Lond B Biol Sci. 1986;314:1–340. - PubMed
-
- Achacoso TB, Yamamoto WS. AY’s Neuroanatomy of C. elegans for Computation. Boca Raton: CRC Press; 1992.
-
- Iturria-Medina Y, Canales-Rodriguez EJ, Melie-Garcia L, et al. Characterizing brain anatomical connections using diffusion weighted MRI and graph theory. Neuroimage. 2007;36:645–660. - PubMed
Publication types
MeSH terms
Grants and funding
LinkOut - more resources
Full Text Sources
