

Hierarchical latency models for dose-time-response associations
- PMID: 21303803
- PMCID: PMC3105259
- DOI: 10.1093/aje/kwq387
Hierarchical latency models for dose-time-response associations
Abstract
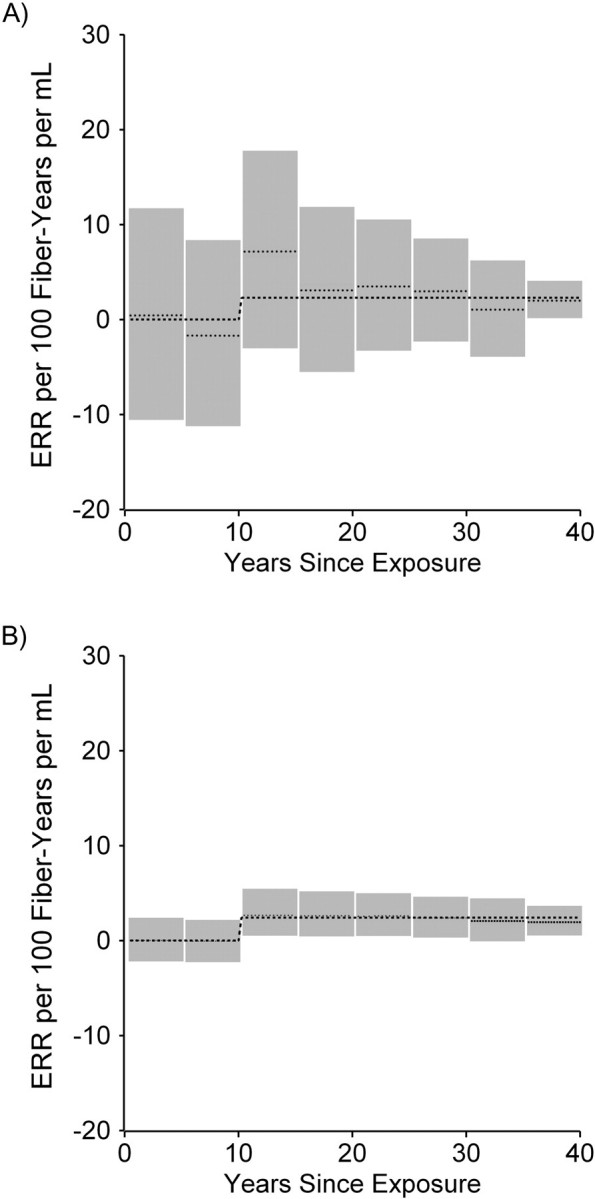
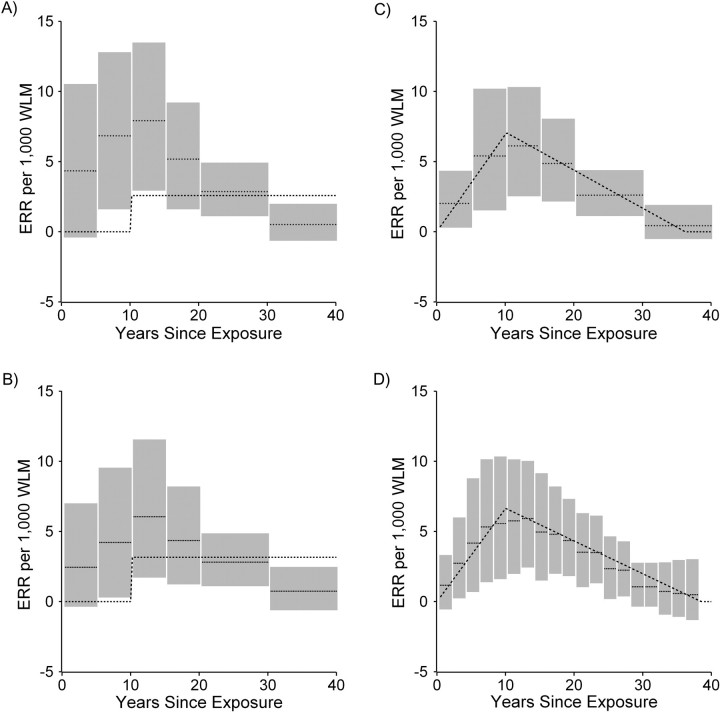
Exposure lagging and exposure-time window analysis are 2 widely used approaches to allow for induction and latency periods in analyses of exposure-disease associations. Exposure lagging implies a strong parametric assumption about the temporal evolution of the exposure-disease association. An exposure-time window analysis allows for a more flexible description of temporal variation in exposure effects but may result in unstable risk estimates that are sensitive to how windows are defined. The authors describe a hierarchical regression approach that combines time window analysis with a parametric latency model. They illustrate this approach using data from 2 occupational cohort studies: studies of lung cancer mortality among 1) asbestos textile workers and 2) uranium miners. For each cohort, an exposure-time window analysis was compared with a hierarchical regression analysis with shrinkage toward a simpler, second-stage parametric latency model. In each cohort analysis, there is substantial stability gained in time window-specific estimates of association by using a hierarchical regression approach. The proposed hierarchical regression model couples a time window analysis with a parametric latency model; this approach provides a way to stabilize risk estimates derived from a time window analysis and a way to reduce bias arising from misspecification of a parametric latency model.
© The Author 2011. Published by Oxford University Press on behalf of the Johns Hopkins Bloomberg School of Public Health. All rights reserved.
Figures
Similar articles
-
Using tensor product splines in modeling exposure-time-response relationships: application to the Colorado Plateau Uranium Miners cohort.Stat Med. 2008 Nov 20;27(26):5484-96. doi: 10.1002/sim.3354. Stat Med. 2008. PMID: 18613262 Free PMC article.
-
Cancer incidence and mortality from exposure to radon progeny among Ontario uranium miners.Occup Environ Med. 2016 Dec;73(12):838-845. doi: 10.1136/oemed-2016-103836. Epub 2016 Sep 20. Occup Environ Med. 2016. PMID: 27651479
-
Clinical measures, smoking, radon exposure, and risk of lung cancer in uranium miners.Occup Environ Med. 1996 Oct;53(10):697-702. doi: 10.1136/oem.53.10.697. Occup Environ Med. 1996. PMID: 8943835 Free PMC article.
-
[Uranium exposure and cancer risk: a review of epidemiological studies].Rev Epidemiol Sante Publique. 2004 Feb;52(1):81-90. doi: 10.1016/s0398-7620(04)99024-4. Rev Epidemiol Sante Publique. 2004. PMID: 15107695 Review. French.
-
Health effects in underground uranium miners.Occup Med. 2001 Apr-Jun;16(2):331-44. Occup Med. 2001. PMID: 11319055 Review.
Cited by
-
Latency estimation for chronic disease risk: a damped exponential weighting model.Eur J Epidemiol. 2020 Sep;35(9):807-819. doi: 10.1007/s10654-020-00658-9. Epub 2020 Jul 30. Eur J Epidemiol. 2020. PMID: 32728914 Free PMC article.
-
Quantifying risk over the life course - latency, age-related susceptibility, and other time-varying exposure metrics.Stat Med. 2016 Jun 15;35(13):2283-95. doi: 10.1002/sim.6864. Epub 2016 Jan 10. Stat Med. 2016. PMID: 26750582 Free PMC article.
-
Environmental exposure mixtures: questions and methods to address them.Curr Epidemiol Rep. 2018 Jun;5(2):160-165. doi: 10.1007/s40471-018-0145-0. Epub 2018 Apr 5. Curr Epidemiol Rep. 2018. PMID: 30643709 Free PMC article.
-
Model averaging in the analysis of leukemia mortality among Japanese A-bomb survivors.Radiat Environ Biophys. 2012 Mar;51(1):93-5; discussion 97-100. doi: 10.1007/s00411-011-0395-4. Epub 2012 Jan 7. Radiat Environ Biophys. 2012. PMID: 22228541
-
A Bayesian approach to investigate life course hypotheses involving continuous exposures.Int J Epidemiol. 2018 Oct 1;47(5):1623-1635. doi: 10.1093/ije/dyy107. Int J Epidemiol. 2018. PMID: 29912384 Free PMC article.
References
-
- Checkoway H, Pearce N, Hickey JL, et al. Latency analysis in occupational epidemiology. Arch Environ Health. 1990;45(2):95–100. - PubMed
-
- Salvan A, Stayner L, Steenland K, et al. Selecting an exposure lag period. Epidemiology. 1995;6(4):387–390. - PubMed
-
- Rothman KJ. Induction and latent periods. Am J Epidemiol. 1981;114(2):253–259. - PubMed
-
- Pearce N. Multistage modelling of lung cancer mortality in asbestos textile workers. Int J Epidemiol. 1988;17(4):747–752. - PubMed
-
- Breslow NE, Day NE. Lyon, France: International Agency for Research on Cancer; 1987. Statistical Methods in Cancer Research: The Design and Analysis of Cohort Studies. - PubMed
Publication types
MeSH terms
Substances
Grants and funding
LinkOut - more resources
Full Text Sources
Medical
