. 2011 Mar;138(5):947-57.
doi: 10.1242/dev.057166.

Characterization of a Dchs1 mutant mouse reveals requirements for Dchs1-Fat4 signaling during mammalian development

Affiliations

Characterization of a Dchs1 mutant mouse reveals requirements for Dchs1-Fat4 signaling during mammalian development

Yaopan Mao et al. Development. 2011 Mar.

Abstract

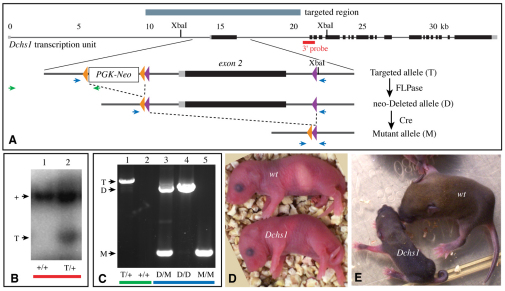
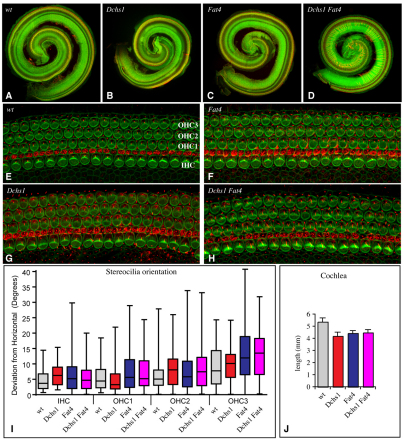
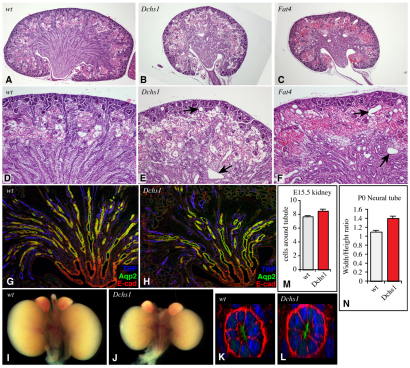
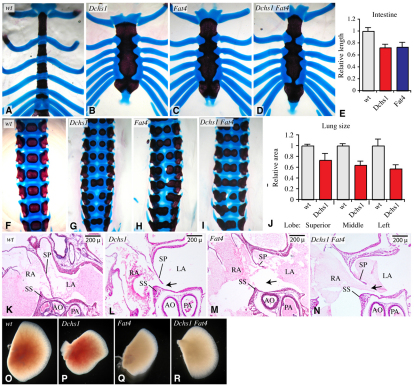
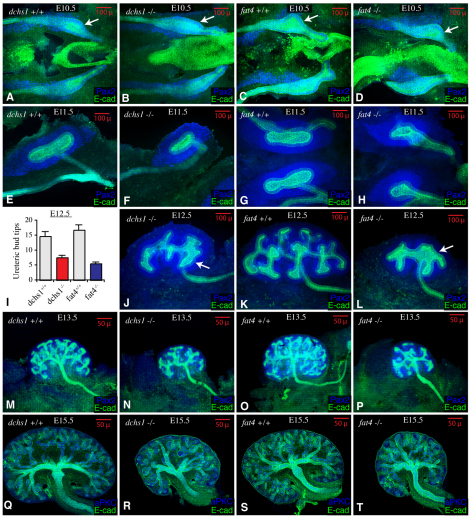
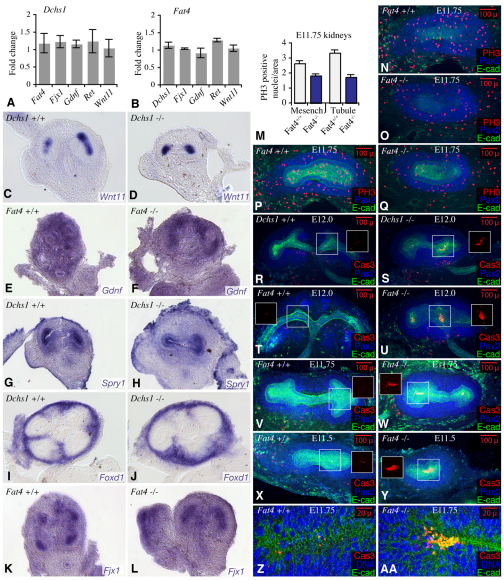
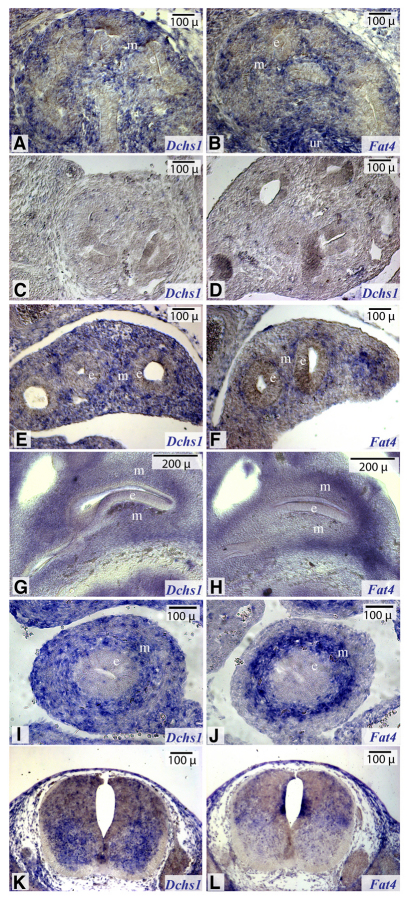
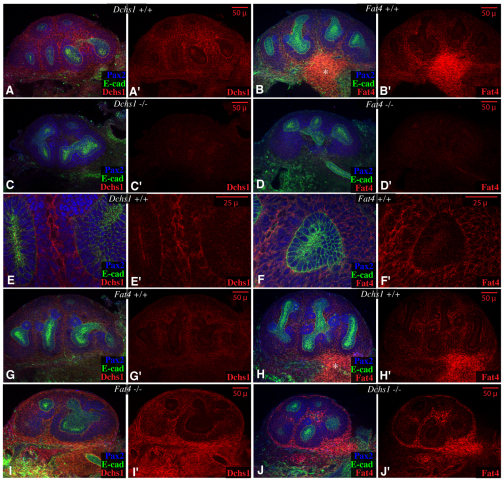
The Drosophila Dachsous and Fat proteins function as ligand and receptor, respectively, for an intercellular signaling pathway that regulates Hippo signaling and planar cell polarity. Although gene-targeted mutations in two mammalian Fat genes have been described, whether mammals have a Fat signaling pathway equivalent to that in Drosophila, and what its biological functions might be, have remained unclear. Here, we describe a gene-targeted mutation in a murine Dachsous homolog, Dchs1. Analysis of the phenotypes of Dchs1 mutant mice and comparisons with Fat4 mutant mice identify requirements for these genes in multiple organs, including the ear, kidney, skeleton, intestine, heart and lung. Dchs1 and Fat4 single mutants and Dchs1 Fat4 double mutants have similar phenotypes throughout the body. In some cases, these phenotypes suggest that Dchs1-Fat4 signaling influences planar cell polarity. In addition to the appearance of cysts in newborn kidneys, we also identify and characterize a requirement for Dchs1 and Fat4 in growth, branching and cell survival during early kidney development. Dchs1 and Fat4 are predominantly expressed in mesenchymal cells in multiple organs, and mutation of either gene increases protein staining for the other. Our analysis implies that Dchs1 and Fat4 function as a ligand-receptor pair during murine development, and identifies novel requirements for Dchs1-Fat4 signaling in multiple organs.


Figures

Fig. 1.
Fig. 1.
A gene-targeted mutation in Dchs1. (A) Map of the Dchs1 locus and targeting strategy. Line below number coordinates represents Dchs1 transcription unit; thin lines are introns; thick lines are exons; gray represents untranslated regions; black represents the open reading frame. Thick line above indicates region of homology in the targeting construct. Lines below show, at higher resolution, a region of the targeting construct and correctly targeted allele (T), with Neo cassette flanked by FRT sites (orange triangles) and exon 2 flanked by loxP sites (purple triangles). Expression of recombinases deletes sequences between these sites, to generate the neo-deleted allele (D) and the Dchs1 mutant allele (M). Blue and green arrows indicate sites of primers for PCR, red bar indicates location of 3′ probe for Southern blotting; relevant XbaI sites are indicated. (B) Southern blot genotyping of XbaI-digested ES cell DNA with a probe 3′ to the targeted region, +, wild-type allele; T, targeted allele. (C) PCR genotyping of mice, alleles are as described in A,B. Colored bars indicate which PCR primers were used for genotyping, as in A. (D) P0 wild-type (top, wt) and Dchs1 mutant (bottom) mice. (E) P7 mice wild-type (right) and Dchs1 mutant (left) mice.
Fig. 2.
Fig. 2.
Ear phenotypes of Dchs1 and Fat4. (A-D) Representative pictures of cochleae from P0 mice of the indicated genotypes, stained for acetylated-tubulin (red) and F-actin (phalloidin, green). (E-H) Representative pictures of hair cells at 50% cochlea length in P0 mice of the indicated genotypes, staining for acetylated-tubulin (red) and F-actin (phalloidin, green) to reveal the orientation of stereocilia. Hair cell rows are labeled (IHC, inner hair cells; OHC, outer hair cells) in E. (I) Quantitation of stereocilia orientation in each row of hair cells in each of four genotypes, as indicated. In this box and whiskers plot, the bars indicate the full range of orientations (numbers analyzed for each set ranged from 45 to 210), the box identifies the central range of values (25% to 75%) and the central line indicates the median. (J) Histogram showing mean cochlea sensory epithelium length in the indicated genotypes; error bars show s.d. The mean length in each mutant was significantly different from wild type (P<0.0005).
Fig. 3.
Fig. 3.
Kidney and neural tube phenotypes in Dchs1 mutants. Paired mutant and wild-type images are always at the same magnification. (A-F) Hematoxylin and Eosin stains on P0 kidneys of wild-type (A,D), Dchs1 (B,E) and Fat4 (C,F) mutants at lower (A-C) and higher (D-F) magnification. Arrows indicate examples of cysts. (G,H) Sections of P0 kidneys stained for Tamm-Horsfall protein [THP (blue)], which marks ascending loop of Henle and distal convoluted tubules, Aquaporin 2 [AQP2 (green)], which marks connecting tubule and collecting duct, and E-cadherin [E-cad (red)], which marks the collecting duct. (I,J) Whole kidneys from P0 mice to indicate the difference in size and shape. (K,L) Sections through representative tubules in E15.5 embryos, stained for E-cadherin (red), DNA (Hoechst, blue) and aPKC (green). (M) Histogram showing mean number of cells around the circumference of E15.5 tubules; error bars indicate s.e.m. The difference in the means is significant (t-test, P=0.014). (N) Histogram of mean width to height ratio in P0 neural tubes sectioned at the position of the heart and lungs; error bars indicate s.e.m. The difference is significant (t-test, P<0.0001).
Fig. 4.
Fig. 4.
Requirement for Dchs1-Fat4 signaling in internal organs. Paired mutant and wild-type images are always at the same magnification. (A-D) Sternums from P0 skeletal preparations of the indicated genotypes, stained with Alcian Blue (for cartilage) and Alizarin Red (for bone). (E) Histogram of average length of intestines in Dchs1 and Fat4 mutants compared with wild type; error bars indicate s.d. The differences between mutants and wild type are significant (t-test, P<0.01). (F-I) Lumbar vertebrae from P0 skeletal preparations of the indicated genotypes. (J) Histogram indicating the relative size of selected lung lobes (superior, middle and left) in Dchs1 mutants compared with wild-type siblings. (K-N) Hearts from P0 mice of the indicated genotypes, stained with Hematoxylin and Eosin. Arrows indicate enlarged ostium secundum in the septum primum (SP). The right atrium (RA), left atrium (LA), septum secundum (SS), aorta (AO) and pulmonary artery (PA) are marked. (O-R) Example of superior lung lobes from P0 mice of the indicated genotypes.
Fig. 5.
Fig. 5.
Influence of Dchs1 and Fat4 on kidney growth and branching. Except for I, panels show kidneys from mutant embryos or their wild-type siblings, stained for E-cad (green) and either Pax2 (A-P) or aPKC (Q-T) (blue). Scale bars are in the top right-hand corner. (A) Wild-type littermate from Dchs1 mutant stock at E10.5 (35 somites). (B) Dchs1 mutant at E10.5 (34 somites). (C) Wild-type littermate from Fat4 mutant stock at E10.5 (36 somites). (D) Fat4 mutant at E10.5 (35 somites). Arrows in A-D indicate ureteric bud. (E) Wild-type littermate from Dchs1 mutant stock at E11.5 (45 somites). (F) Dchs1 mutant at E11.5 (45 somites). (G) Wild-type littermate from Fat4 mutant stock at E11.5 (47 somites). (H) Fat4 mutant at E11.5 (46 somites). (I) Histogram showing average number of ureteric bud tips in E12.5 kidneys from the indicated genotypes. The difference between wild type and mutant is highly significant (P<0.0001); the difference between Dchs1 and Fat4 is also significant (P=0.014). Error bars show s.e.m. (J) Dchs1 mutant at E12.5. (K) Wild-type littermate from Fat4 mutant stock at E12.5. (L) Fat4 mutant, at E12.5. Arrows in J,L highlight regions where the epithelium appears broader and distorted. (M) Wild-type littermate from Dchs1 mutant stock at E13.5. (N) Dchs1 mutant at E13.5. (O) Wild-type littermate from Fat4 mutant stock at E13.5. (P) Fat4 mutant at E13.5. (Q) Wild-type littermate from Dchs1 mutant stock at E15.5. (R) Dchs1 mutant at E15.5. (S) Wild-type littermate from Fat4 mutant stock at E15.5. (T) Fat4 mutant at E15.5.
Fig. 6.
Fig. 6.
Analysis of early kidney development in mutants. (A,B) Histograms indicate fold change (levels in mutant/levels in wild type) detected by quantitative RT-PCR for transcripts of the indicated genes in E12.5 Dchs1 (A) or Fat4 (B) mutant kidneys; no significant change was detected for any of these genes. Expression levels were normalized to β-Actin. Error bars show s.d. (C-L) Representative examples of expression, detected by in situ hybridization to sections of E12.5 kidneys, for Wnt11 (C,D), Gdnf (E,F), Sprouty1 (Spry1, G,H), Foxd1 (I,J) and Fjx1 (K,L). Kidneys shown are matched pairs, stained together; all were examined multiple times in both Dchs1 and Fat4. (M) Histogram showing average number of PH3-positive nuclei per unit area in sections of kidneys between E11.5 and E12.0 (47-51 somites). (N-AA) Embryonic kidneys are stained with E-cad (green) and an antisera that recognizes Pax2, Pax5 and Pax8 (Pax2, blue). Kidneys shown are matched pairs from mutants and their wild-type siblings. Scale bars are in the top right-hand corner. (N-Q) Representative examples of PH3 staining in E11.75 kidneys from animals of the indicated genotypes. (N,O) Examples used for analysis of mesenchymal PH3. (P,Q) Examples used for analysis of epithelial PH3. (R-AA) Examples of Cas3 staining in kidneys of the indicated genotypes and ages. Insets show the Cas3 stain only for the boxed region to facilitate visualization of apoptosis. (Z,AA) Cas3 stains at higher magnification.
Fig. 7.
Fig. 7.
Dchs1 and Fat4 mRNA expression at E12.5. Tissue sections or slices through organs from E12.5 embryos, hybridized with probes detecting Dchs1 (A,C-E,G,I,K) or Fat4 (B,F,H,J,L), as indicated, and stained blue. ur, ureter; m, mesenchyme; e, epithelium. (A,B) Wild-type kidneys. (C,D) Dchs1 mutant kidney (C) and lung (D). (E,F) Wild-type lungs. (G,H) Wild-type cochlea. (I,J) Wild-type intestine. (K,L) Wild-type neural tube.
Fig. 8.
Fig. 8.
Dchs1 and Fat4 protein expression in kidneys. All panels show E12.5 kidneys, stained for E-cad (green), Pax2/5/8 (Pax2, blue) and either Dchs1 or Fat4 (red), as indicated. Panels marked by prime symbols show the Dchs1 or Fat4 channel only of the stain on the left. Scale bars are in the top right-hand corner; asterisk (B,H) indicates mesenchymal cells surrounding the ureter with strong Fat4 expression. (A,A′) Wild-type littermates from Dchs1 mutant stock, stained for Dchs1. (B,B′) Wild-type littermates from Fat4 mutant stock, stained for Fat4. (C,C′) Dchs1 mutant, stained for Dchs1. Some staining is detected in the epithelia, which we infer represents non-specific background from the antisera. (D,D′) Fat4 mutant, stained for Fat4. Some staining is detected in the epithelia, which we infer represents non-specific background from the antisera. A,C and B,D are matched pairs, dissected from the same litters, and fixed, stained and imaged under identical conditions. (E,E′) Higher magnification of Dchs1 staining. (F,F′) Higher magnification of Fat4 staining. (G,G′) Wild-type littermates from Fat4 mutant stock, stained for Dchs1. (H,H′) Wild-type littermates from Dchs1 mutant stock, stained for Fat4. (I,I′) Fat4 mutant, stained for Dchs1 (note increased expression relative to G). (J,J′) Dchs1 mutant, stained for Fat4 (note increased expression relative to H). G,I and H,J are matched pairs, dissected from the same litters, and fixed, stained and imaged under identical conditions.

References

    1. Basson M. A., Watson-Johnson J., Shakya R., Akbulut S., Hyink D., Costantini F. D., Wilson P. D., Mason I. J., Licht J. D. (2006). Branching morphogenesis of the ureteric epithelium during kidney development is coordinated by the opposing functions of GDNF and Sprouty1. Dev. Biol. 299, 466-477 - PubMed
    1. Brittle A. L., Repiso A., Casal J., Lawrence P. A., Strutt D. (2010). Four-jointed modulates growth and planar polarity by reducing the affinity of dachsous for fat. Curr. Biol. 20, 803-810 - PMC - PubMed
    1. Cardoso W. V., Lü J. (2006). Regulation of early lung morphogenesis: questions, facts and controversies. Development 133, 1611-1624 - PubMed
    1. Casal J., Struhl G., Lawrence P. (2002). Developmental compartments and planar polarity in Drosophila. Curr. Biol. 12, 1189-1198 - PubMed
    1. Castillejo-Lopez C., Arias W. M., Baumgartner S. (2004). The fat-like gene of Drosophila is the true orthologue of vertebrate fat cadherins and is involved in the formation of tubular organs. J. Biol. Chem. 279, 24034-24043 - PubMed

Publication types