

Interleukin-13 (IL-13)/IL-13 receptor alpha1 (IL-13Ralpha1) signaling regulates intestinal epithelial cystic fibrosis transmembrane conductance regulator channel-dependent Cl- secretion
- PMID: 21303908
- PMCID: PMC3075682
- DOI: 10.1074/jbc.M110.214965
Interleukin-13 (IL-13)/IL-13 receptor alpha1 (IL-13Ralpha1) signaling regulates intestinal epithelial cystic fibrosis transmembrane conductance regulator channel-dependent Cl- secretion
Abstract
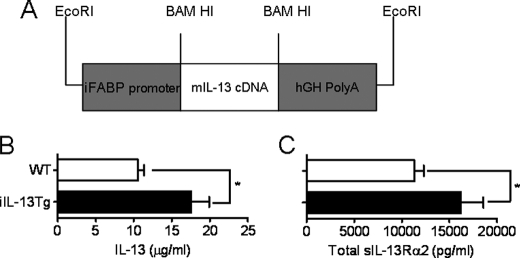
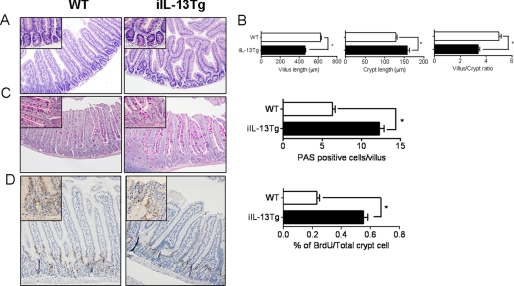
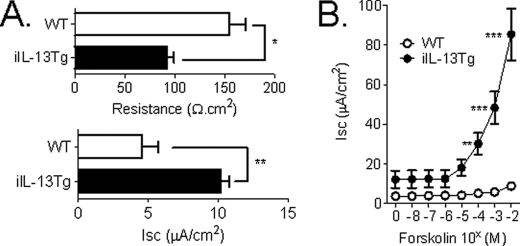
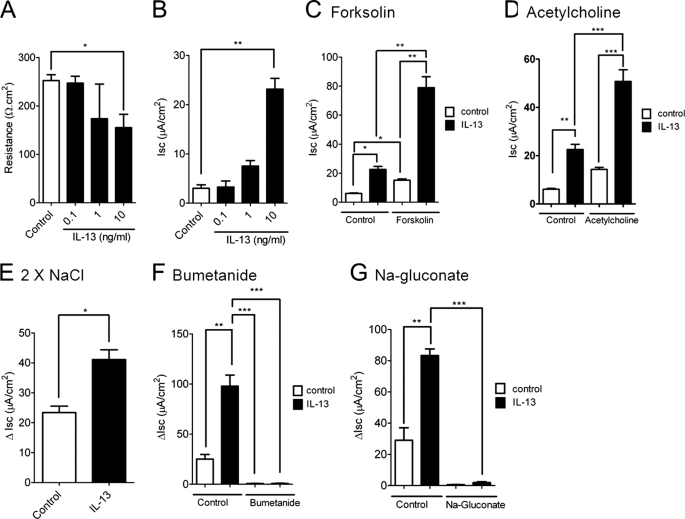
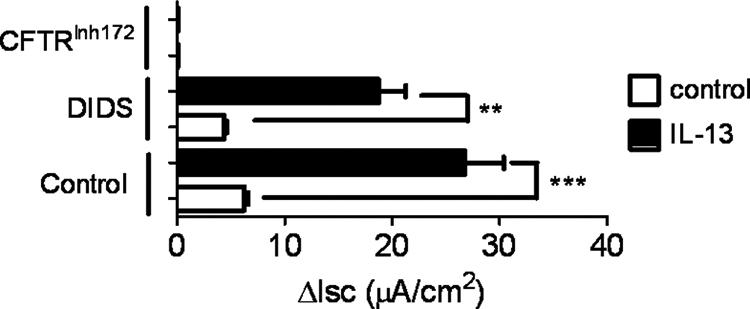
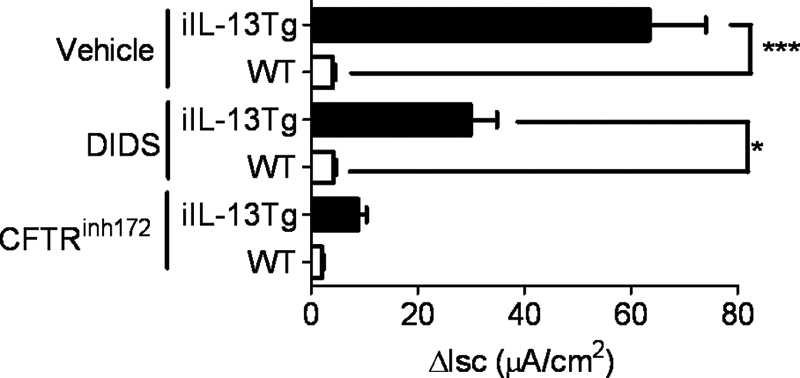
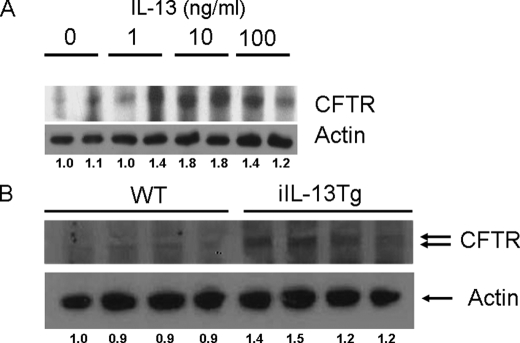
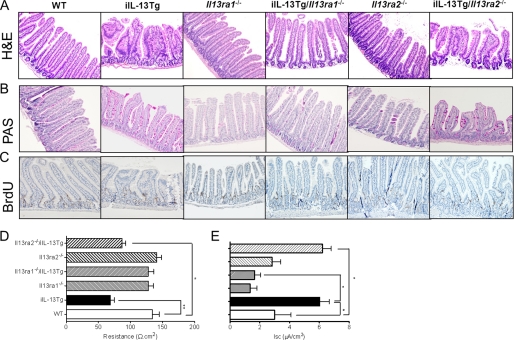
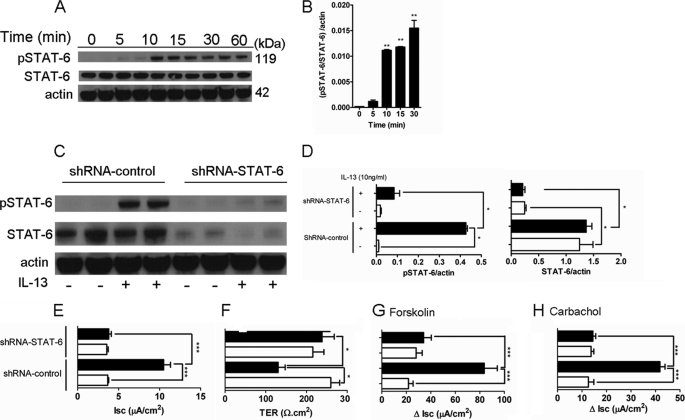
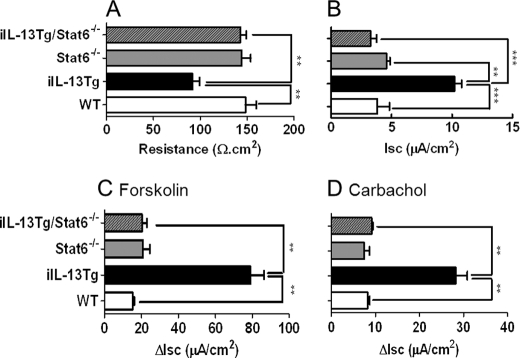
Interleukin-13 (IL-13) has been linked to the pathogenesis of inflammatory diseases of the gastrointestinal tract. It is postulated that IL-13 drives inflammatory lesions through the modulation of both hematopoietic and nonhematopoietic cell function in the intestine. To delineate the relevant contribution of elevated levels of intestinal IL-13 to intestinal structure and function, we generated an intestinal IL-13 transgenic mouse (iIL-13Tg). We show that constitutive overexpression of IL-13 in the small bowel induces modification of intestinal epithelial architecture (villus blunting, goblet cell hyperplasia, and increased epithelial proliferation) and epithelial function (altered basolateral → apical Cl(-) ion conductance). Pharmacological analyses in vitro and in vivo determined that elevated Cl(-) conductance is mediated by altered cystic fibrosis transmembrane conductance regulator expression and activity. Generation of iIL-13Tg/Il13rα1(-/-), iIL-13Tg/Il13rα2(-/-), and iIL-13Tg/Stat6(-/-) mice revealed that IL-13-mediated dysregulation of epithelial architecture and Cl(-) conductance is dependent on IL-13Rα1 and STAT-6. These observations demonstrate a central role for the IL-13/IL-13Rα1 pathway in the regulation of intestinal epithelial cell Cl(-) secretion via up-regulation of cystic fibrosis transmembrane conductance regulator, suggesting an important role for this pathway in secretory diarrhea.
Figures
Similar articles
-
AC6 is the major adenylate cyclase forming a diarrheagenic protein complex with cystic fibrosis transmembrane conductance regulator in cholera.J Biol Chem. 2018 Aug 17;293(33):12949-12959. doi: 10.1074/jbc.RA118.003378. Epub 2018 Jun 14. J Biol Chem. 2018. PMID: 29903911 Free PMC article.
-
Activation of intestinal Cl- secretion by lubiprostone requires the cystic fibrosis transmembrane conductance regulator.Gastroenterology. 2009 Sep;137(3):976-85. doi: 10.1053/j.gastro.2009.05.037. Epub 2009 May 18. Gastroenterology. 2009. PMID: 19454284
-
Activation of constitutive androstane receptor inhibits intestinal CFTR-mediated chloride transport.Biomed Pharmacother. 2019 Mar;111:1249-1259. doi: 10.1016/j.biopha.2019.01.015. Epub 2019 Jan 15. Biomed Pharmacother. 2019. PMID: 30841439
-
CFTR-NHERF2-LPA₂ Complex in the Airway and Gut Epithelia.Int J Mol Sci. 2017 Sep 4;18(9):1896. doi: 10.3390/ijms18091896. Int J Mol Sci. 2017. PMID: 28869532 Free PMC article. Review.
-
Pharmacotherapy of the ion transport defect in cystic fibrosis.Clin Exp Pharmacol Physiol. 2001 Nov;28(11):857-67. doi: 10.1046/j.1440-1681.2001.03541.x. Clin Exp Pharmacol Physiol. 2001. PMID: 11703384 Review.
Cited by
-
Goblet cell hyperplasia is not epithelial-autonomous in the Cftr knockout intestine.Am J Physiol Gastrointest Liver Physiol. 2022 Feb 1;322(2):G282-G293. doi: 10.1152/ajpgi.00290.2021. Epub 2021 Dec 8. Am J Physiol Gastrointest Liver Physiol. 2022. PMID: 34878935 Free PMC article.
-
Functional role of kallikrein 5 and proteinase-activated receptor 2 in eosinophilic esophagitis.Sci Transl Med. 2020 May 27;12(545):eaaz7773. doi: 10.1126/scitranslmed.aaz7773. Sci Transl Med. 2020. PMID: 32461336 Free PMC article.
-
Gut microbiome remodeling and metabolomic profile improves in response to protein pacing with intermittent fasting versus continuous caloric restriction.Nat Commun. 2024 May 28;15(1):4155. doi: 10.1038/s41467-024-48355-5. Nat Commun. 2024. PMID: 38806467 Free PMC article. Clinical Trial.
-
IL-13 Stimulates Proliferation and Expression of Mucin and Immunomodulatory Genes in Cultured Conjunctival Goblet Cells.Invest Ophthalmol Vis Sci. 2015 Jul;56(8):4186-97. doi: 10.1167/iovs.14-15496. Invest Ophthalmol Vis Sci. 2015. PMID: 26132778 Free PMC article.
-
Manipulating DNA damage-response signaling for the treatment of immune-mediated diseases.Proc Natl Acad Sci U S A. 2017 Jun 13;114(24):E4782-E4791. doi: 10.1073/pnas.1703683114. Epub 2017 May 22. Proc Natl Acad Sci U S A. 2017. PMID: 28533414 Free PMC article.
References
-
- Wynn T. A. (2003) Annu. Rev. Immunol. 21, 425–456 - PubMed
-
- Mentink-Kane M. M., Wynn T. A. (2004) Immunol. Rev. 202, 191–202 - PubMed
-
- Urban J. F., Jr., Noben-Trauth N., Donaldson D. D., Madden K. B., Morris S. C., Collins M., Finkelman F. D. (1998) Immunity 8, 255–264 - PubMed
-
- Heller F., Fuss I. J., Nieuwenhuis E. E., Blumberg R. S., Strober W. (2002) Immunity 17, 629–638 - PubMed
Publication types
MeSH terms
Substances
Grants and funding
LinkOut - more resources
Full Text Sources
Other Literature Sources
Medical
Molecular Biology Databases
Research Materials
Miscellaneous
