. 2011 Apr;152(4):1222-33.
doi: 10.1210/en.2010-1034. Epub 2011 Feb 8.

Transgenic overexpression of the extra-large Gsα variant XLαs enhances Gsα-mediated responses in the mouse renal proximal tubule in vivo

Affiliations

Transgenic overexpression of the extra-large Gsα variant XLαs enhances Gsα-mediated responses in the mouse renal proximal tubule in vivo

Zun Liu et al. Endocrinology. 2011 Apr.

Abstract

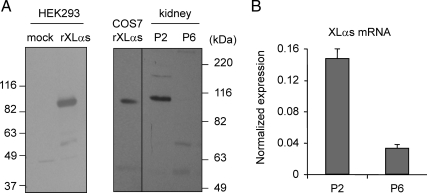
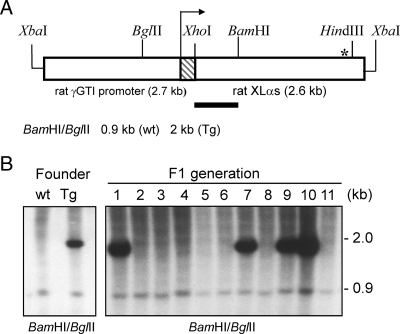
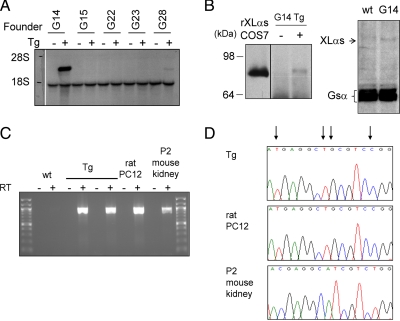
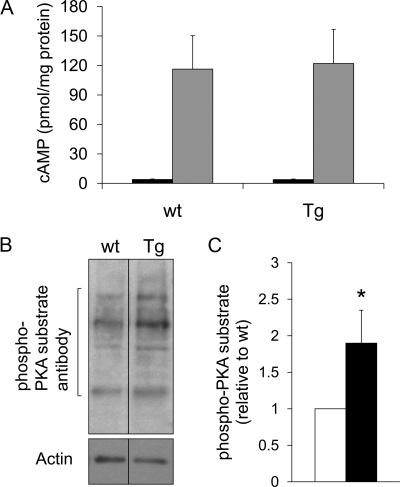
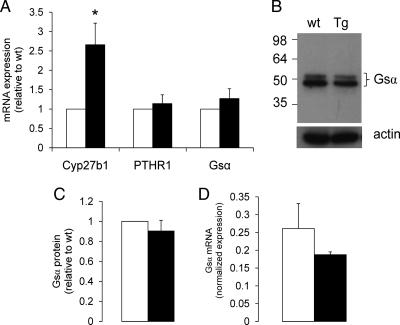
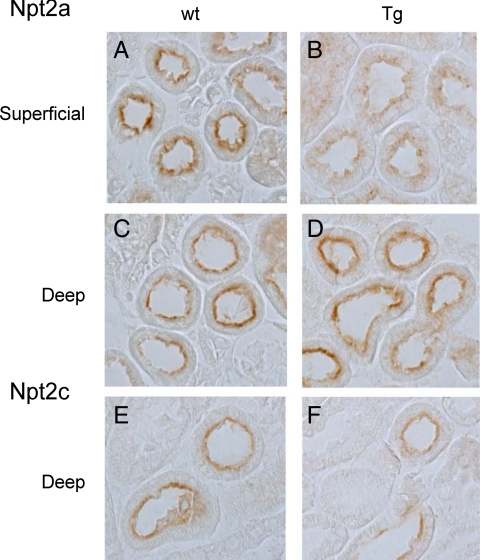
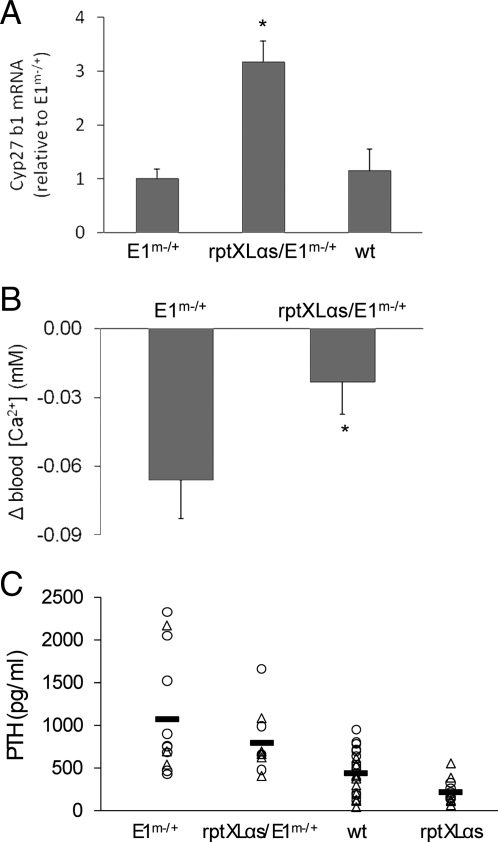
XLαs, a variant of the stimulatory G protein α-subunit (Gsα), can mediate receptor-activated cAMP generation and, thus, mimic the actions of Gsα in transfected cells. However, it remains unknown whether XLαs can act in a similar manner in vivo. We have now generated mice with ectopic transgenic expression of rat XLαs in the renal proximal tubule (rptXLαs mice), where Gsα mediates most actions of PTH. Western blots and quantitative RT-PCR showed that, while Gsα and type-1 PTH receptor levels were unaltered, protein kinase A activity and 25-hydroxyvitamin D 1-α-hydroxylase (Cyp27b1) mRNA levels were significantly higher in renal proximal tubules of rptXLαs mice than wild-type littermates. Immunohistochemical analysis of kidney sections showed that the sodium-phosphate cotransporter type 2a was modestly reduced in brush border membranes of male rptXLαs mice compared to gender-matched controls. Serum calcium, phosphorus, and 1,25 dihydroxyvitamin D were within the normal range, but serum PTH was ∼30% lower in rptXLαs mice than in controls (152 ± 16 vs. 222 ± 41 pg/ml; P < 0.05). After crossing the rptXLαs mice to mice with ablation of maternal Gnas exon 1 (E1(m-/+)), male offspring carrying both the XLαs transgene and maternal Gnas exon 1 ablation (rptXLαs/E1(m-/+)) were significantly less hypocalcemic than gender-matched E1(m-/+) littermates. Both E1(m-/+) and rptXLαs/E1(m-/+) offspring had higher serum PTH than wild-type littermates, but the degree of secondary hyperparathyroidism tended to be lower in rptXLαs/E1(m-/+) mice. Hence, transgenic XLαs expression in the proximal tubule enhanced Gsα-mediated responses, indicating that XLαs can mimic Gsα in vivo.


Figures

Fig. 1.
Fig. 1.
Endogenous XLαs expression in early postnatal kidney of wild-type mouse. A, Western blot analysis using the antirat/mouse XLαs antiserum developed in our lab was used to assess expression of XLαs protein in whole kidneys from P2 and P6 mice. The anti-XLαs antiserum was characterized by analyzing lysates of HEK293 and COS7 cells transfected or adenovirally transduced with cDNA encoding rat XLαs, respectively. B, Real-time RT-PCR revealed a dramatic decline in the renal XLαs mRNA level from P2 to P6. One microgram total RNA was used as template for real-time RT-PCR; data were normalized to the percent of Gsα mRNA, which was amplified with similar cycle thresholds from P2 and P6 samples. Data are representative of three experiments with similar results.
Fig. 2.
Fig. 2.
Development of transgenic mice with targeted ectopic expression of rat XLαs in the renal proximal tubule. A, Transgene for targeting XLαs expression to renal proximal tubules was constructed by placing rat XLαs cDNA immediately downstream of the type-I rat γ-GTI and exon 1 (hatched box); the arrow indicates the start of the transcribed portion; asterisk indicates the approximate location of the termination codon. The probe (horizontal bar) was a 1-kb XhoI/BamHI fragment of the transgene. B, Southern blot analysis of tail-tip DNA demonstrated genomic incorporation of the transgene and its transmission to the F1 generation. Data were obtained from the G28 line; wt, wild-type; Tg, transgenic.
Fig. 3.
Fig. 3.
Transgenic expression of XLαs in mouse kidney. A, Northern blots using the same probe used in Southern blot analyses indicated expression of rat XLαs transcript in kidneys from the F1 generation of the G14 and G28 founder lines. XLαs expression was not detectable in the remaining three lines. Whole kidneys were isolated at 2 months of age. The presence or the absence of the transgene (Tg) in the genomic DNA is indicated by + or −, respectively. B, Western blot analysis using a polyclonal antiserum against the C terminus of XLαs demonstrated expression of XLαs in total lysates of proximal tubule enriched renal cortices from G14 rptXLαs mice but not wild-type littermates. Lysates from COS7 cells transiently transfected with rat XLαs cDNA were used as a positive control. Results were obtained from two different sets of transgenic and wild-type littermates, and the proteins were separated on either 7% (left) or 10% (right) SDS-PAGE. The exposure of the x-ray film was increased in the image derived from the 10% SDS-PAGE to visualize both XLαs and Gsα. C, XLαs transcript was amplified by RT-PCR using total RNA from 2-month-old rptXLαs mice. Total RNA from P2 mouse kidney and rat pheochromocytoma PC12 cells were used as controls. Primers were designed to amplify both mouse and rat XLαs and corresponded to sequences from exon XL (forward) and exon 5 (reverse); RT, reverse transcriptase. D, Nucleotide sequence analysis of RT-PCR amplicons confirmed the expression of the transgenic rat XLαs mRNA in rptXLαs mice. A short segment of the sequence traces is shown as an example. Nucleotides that differ between mouse and rat are indicated by arrows above the sequence traces.
Fig. 4.
Fig. 4.
Elevated basal PKA activity, but not PTH-induced cAMP accumulation, in renal proximal tubules of rptXLαs mice. A, Treatment of proximal tubule enriched renal cortices with 10−8 m PTH in the presence of isobutyl methylxanthine resulted in a marked increase in cAMP accumulation, but this response was similar in wild-type (wt) and rptXLαs (Tg) littermates. Data represent mean ± sem basal (black bars) and PTH-stimulated (gray bars) cAMP levels obtained from four (basal) or five (PTH-stimulated) independent experiments, each including a transgenic mice and a wild-type littermate. B, Western blot analysis using a phospho-PKA substrate antibody showed increased immunoreactivity of multiple proteins in lysates of proximal tubule-enriched renal cortices from rptXLαs mice (Tg) compared with wild-type littermates (wt). The image is representative of five independent experiments with similar results. B, Quantitative analysis of the Western blot data were performed by densitometry. Data are mean ± sem of five independent experiments. Wild-type (white bar); rptXLαs (black bar). *, P < 0.05 compared with wild-type according to Student's t test for paired samples.
Fig. 5.
Fig. 5.
Increased Cyp27b1 mRNA expression in rptXLαs mice. A, Real-time RT-PCR experiments showed that the proximal tubular abundance of Cyp27b1, but not PTHR1 or Gsα, mRNA is significantly elevated in rptXLαs mice (black bars) compared with wild-type littermates (white bars). Levels were measured first relative to β-actin mRNA, and subsequently, each experiment was normalized to the level in wild-type littermates. Data are mean ± sem of four independent experiments. *, P < 0.05 compared with wild-type according to Student's t test for paired samples. B, Western blot experiments showed that the endogenous Gsα protein levels are comparable in rptXLαs mice (Tg) and wild-type littermates (wt). C, Densitometric analysis of data presented in B; wild-type (white bar); rptXLαs (black bar). Data are mean ± sem of three independent experiments. D, Real-time RT-PCR experiments by using renal proximal tubules isolated by laser capture microscopy confirmed that Gsα transcript levels are not higher in rptXLαs mice (black bar) than wild-type controls (white bar). Expression levels were calculated by using β-actin mRNA as a reference control. Data are mean ± sem of two independent experiments.
Fig. 6.
Fig. 6.
Reduced Npt2a expression at the brush border membranes of superficial renal cortex from male rptXLαs mice. Immunohistochemical analysis of kidney sections using an antibody against the C-terminal portion of Npt2a revealed lower abundance and partial internalization of this transporter in the superficial (A and B) but not deep (C and D) cortex of male rptXLαs mice. No remarkable differences were present between transgenic and wild-type mice with respect to the abundance and subcellular localization of Npt2c (E and F). Data are representative of three independent experiments.
Fig. 7.
Fig. 7.
Partial rescue by the XLαs transgene of the phenotype observed in E1m−/+ mice. A, Based on real-time RT-PCR analysis of proximal tubule-enriched renal cortices, Cyp27b1 transcript levels were significantly higher in rptXLαs/E1m−/+ mice than both E1m−/+ and wild-type (wt) littermates. Expression levels were calculated with Sdha mRNA as a reference control, and the mean values in each experiment were normalized to those obtained from E1m−/+ mice. Data represent mean ± sem of at least four independent experiments in which eight E1m−/+ (three males and five females), five rptXLαs/E1m−/+ (three males and two females), and five wild-type (two males and three females) mice were analyzed. *, P < 0.001 compared with E1m−/+ and P < 0.01 compared with wild-type mice by one-way ANOVA. B, The reduction of serum ionized calcium was significantly more pronounced in male E1m−/+ mice than in gender-matched rptXLαs/E1m−/+ mice. Differences were calculated by subtracting individual measurements from the mean value obtained from wild-type mice. Data are mean ± sem (n = 11 for E1m−/+ and n = 7 for rptXLαs/E1m−/+). *, P < 0.05 according to Student's t test. C, Serum PTH values of the offspring from rptXLαs and E1m−/+ crosses showed significantly higher PTH in E1m−/+ mice compared with wild-type (wt) and rptXLαs mice, while the difference between E1m−/+ and rptXLαs/E1m−/+ mice were not statistically significant. Individual data points with calculated mean values (horizontal lines) are shown. The numbers of male and female mice analyzed and the mean values are the same as those given in Table 2. Females and males are depicted by triangles and circles, respectively. Median values were 751, 679, 420, and 182 pg/ml, respectively.

Similar articles

Cited by

References

    1. Weinstein LS, Liu J, Sakamoto A, Xie T, Chen M. 2004. Minireview: GNAS: normal and abnormal functions. Endocrinology 145:5459–5464 - PubMed
    1. Plagge A, Kelsey G, Germain-Lee EL. 2008. Physiological functions of the imprinted Gnas locus and its protein variants Galpha(s) and XLalpha(s) in human and mouse. J Endocrinol 196:193–214 - PubMed
    1. Kozasa T, Itoh H, Tsukamoto T, Kaziro Y. 1988. Isolation and characterization of the human Gsα gene. Proc Natl Acad Sci USA 85:2081–2085 - PMC - PubMed
    1. Kehlenbach RH, Matthey J, Huttner WB. 1994. XLαs is a new type of G protein. Nature [Erratum (1995) 375:253] 372:804–809 - PubMed
    1. Hayward B, Kamiya M, Strain L, Moran V, Campbell R, Hayashizaki Y, Bronthon DT. 1998. The human GNAS1 gene is imprinted and encodes distinct paternally and biallelically expressed G proteins. Proc Natl Acad Sci USA 95:10038–10043 - PMC - PubMed

Publication types

Substances