. 2011 Jul;19(7):1342-52.
doi: 10.1038/mt.2010.315. Epub 2011 Feb 8.

Imaging stem cell-derived persistent foci after in vivo selection of lentiviral MGMT-P140K transduced murine bone marrow cells

Affiliations

Imaging stem cell-derived persistent foci after in vivo selection of lentiviral MGMT-P140K transduced murine bone marrow cells

Yuan Lin et al. Mol Ther. 2011 Jul.

Abstract

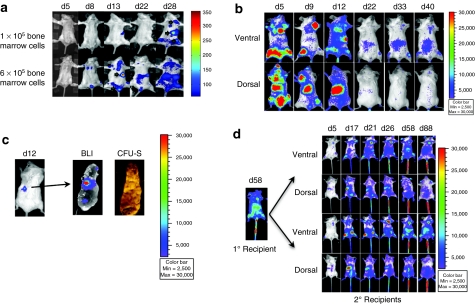
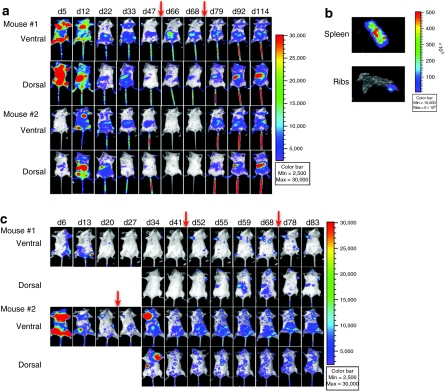
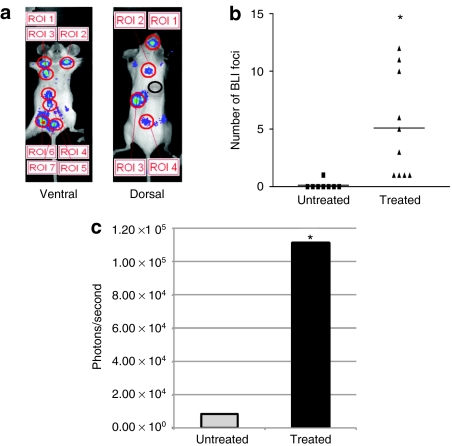
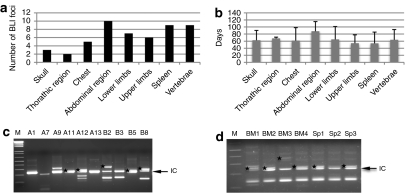
The engraftment of hematopoietic stem cells (HSCs) after drug resistance gene transfer and drug selection may recapitulate stress response hematopoiesis, but the processes remain elusive. Homing, trafficking, and localization of transduced cells and the impact of insertion site on focal expansion have not been well characterized. With the goal of optimizing and understanding these processes under conditions of low multiplicity of infection (MOI) lentiviral gene transfer, we used drug resistance gene O(6)-methylguanine-DNA methyltransferase (MGMT)-P140K and in vivo selection to enrich for transduced and transgene-expressing HSCs. To systemically monitor homing, trafficking, and expansion after transplantation and drug selection over time, we linked MGMT-P140K to the firefly luciferase gene in lentiviral self-inactivating vectors. Periodic bioluminescence imaging (BLI) of transplanted recipients was followed for up to 9 months after both primary and secondary transplantation. Initial dispersion and widespread early homing and engraftment were transient, followed by detection of persistent and discrete foci at stable tissue sites after in vivo drug selection. From these studies, we concluded that drug resistance gene transfer followed by early or late drug selection can result in stable gene expression and cell expansion in persistent foci of transduced bone marrow cells that often remain in fixed sites for extended periods of time.


Figures

Figure 1
Figure 1
Lentiviral vector construct and transgene expression in cell lines. (a) The construct of bicistronic lentiviral vector plasmid (pLV-mnd-P2AL) contained MGMT-P140K gene and firefly luciferase gene linked by foot and mouth disease virus (FMDV) 2A cleavage site and was controlled by an MND promoter. (b) In vitro transduction experiments by transducing 293T and K562 cells with lentiviruses (LV-mnd-P2AL) made with above bicistronic lentiviral vector plasmid at multiplicity of infection (MOI) of 1 showed robust MGMT-P140K expression over 21 weeks. (c) C3H murine bone marrow cells were transduced with LV-mnd-P2AL and treated with O6-benzylguanine (BG) and various concentrations of 1,3-bis(2-chloroethyl)-1-nitrosourea (BCNU), and analysis of surviving colonies in colony-forming unit (CFU) showed strong protection in lentiviral transduced primary bone marrow cells against BCNU treatment. BM, bone marrow; MGMT, O6-methylguanine-DNA methyltransferase.
Figure 2
Figure 2
Bone marrow cell engraftment appeared in a cell dose-dependent manner and became less active with time. (a) 1 × 10⁵ and 6 × 10⁵ lentivirus (LV)-mnd-P2AL transduced Balb/C bone marrow cells showed a dose-dependent engraftment pattern after transplantation. Green arrows indicated the locations of the foci. Images in this figure were taken with a Case BME prototype imaging system. Images were pseudocolored and analyzed with Matlab software. The remaining images throughout this paper were taken and analyzed with Xenogen IVIS 200 and its software. (b) 1 × 10⁶ transduced bone marrow cells showed early rapid engraftment and expansion at day 5, but transgene expression started to fade after 3–4 weeks without any drug selection. (c) Lethally irradiated recipient received 5 × 10⁵ transduced bone marrow cells and imaged on day 12. After BLI imaging, spleen was removed and imaged for bioluminescence, and then spleen was fixed and photographed for CFU-S. (d) Serial transplantation of lentiviral transduced bone marrow cells. At day 58 after primary transplantation, 3 × 10⁶ bone marrow cells from primary recipient was transplanted into four secondary recipients. Identical engraftment and expansion pattern was observed in secondary recipients as seen in the primary recipients. None of the secondary recipients received any drug treatment.
Figure 3
Figure 3
BG+TMZ treatment enhanced transgene expression in lethally irradiated and nonmyeloablated recipients. (a) Two lethally irradiated mice received 1 × 10⁶ lentivirus (LV)-mnd-P2AL transduced bone marrow cells and BG+TMZ treatments for 3 days beginning on day 48 and day 75 (indicated with red arrows). Both ventral and dorsal views are shown. (b) Spleen and chest rib were collected at the termination of the experiment, placed in a 100-mm dish, and imaged to confirm bioluminescence signal in both locations. (c) In two nonmyeloablated recipients, sample mouse #1 received 5 × 10⁵ transduced bone marrow cells and 5 × 10⁵ untransduced supporting cells and was treated with BG+TMZ for 3 days beginning on days 44 and 69, and sample mouse #2 received 5 × 10⁵ transduced bone marrow cells and 5 × 10⁵ untransduced supporting cells and three rounds of BG+TMZ treatments for 3 days beginning on days 21, 44, and 69 (drug treatments indicated with red arrows). Both ventral and dorsal views are presented in the figure. BG, O6-benzylguanine; TMZ, temozolomide.
Figure 4
Figure 4
Semiquantitative analysis of bioluminescence imaging (BLI) signal showed increased engraftment and transgene expression after BG+TMZ treatment. Four groups of animals are compared longitudinally for evidence of BLI positive cells based on preconditioning status. The groups are: (i) untransduced bone marrow cells in nonmyeloablated recipients (n = 2), (ii) transduced bone marrow cells (BMC) in nonmyeloablated recipients without BG+TMZ treatments (n = 1), (iii) transduced BMC in nonmyeloablated recipients given BG+TMZ treatments (n = 2), and (iv) transduced BMC in lethally irradiated recipients given BG+TMZ treatments (n = 2). Image intensity was compared over time for the total body, as well as regions and organ sites. (a) Whole body comparison, (b) comparison in bone marrows of all of the limbs, (c) chest, (d) abdomen, (e) spleen, (f) vertebral bodies. Cyan arrows (↓) in c indicate the start of the 3-day drug treatments in nonmyeloablated recipients and green arrows (↓) in d indicate the start of the 3-day drug treatments in lethally irradiated recipients. BG, O6-benzylguanine; TMZ, temozolomide.
Figure 5
Figure 5
Persistent bioluminescence imaging (BLI) foci resulted from in vivo drug selection. Predefined “regions of interest” (ROI) analysis was used to measure persistent BLI foci from both ventral and dorsal sides of recipient mice. Measurements from 18 recipients of both lethally and nonmyeloablated preconditioning were pooled together to measure persistent foci, stratified by drug treatment. (a) An example of persistent foci selected with predefined ROI. The black circle in the dorsal image is an example of background used in the comparative measurement of foci intensity. (b) The number of persistent foci identified averaged 0.125 per mouse in untreated mice compared to 5.1 per mouse in treated recipients, P < 0.01. (c) The mean ± SD of BLI intensity were 8,389.43 ± 6,353.17 photons/second (data range: 5,826.11–24,027.67) in untreated mice and 11,1019.15 ± 18,7641.07 photons/second (~13-fold increase, data range: 24,033.33–10,45000) in chemotherapy treated mice, P < 0.01.
Figure 6
Figure 6
Distribution of persistent foci in recipient animals and insertion analysis of colony-forming unit (CFU) colonies of transduced bone marrow cells in vitro and after in vivo drug selection. Detailed analysis of persistent bioluminescence imaging (BLI) foci was performed from 10 recipients after drug treatment. (a) Tissue localization of persistent foci was enumerated based on 2D BLI images. (b) The duration of visual detection of these persistent tissue foci (n = 51 foci analyzed). (c) Linear amplification-mediated PCR (LAM-PCR) of transgene positive CFU colonies (n = 19) collected from LV-mnd-P2AL transduced bone marrow cells before transplantation (without prior drug treatment). (d) LAM-PCR of transgene positive CFU colonies collected from bone marrow (lanes BM1–BM4) and spleen (lanes Sp1–Sp3) of one of the recipient mice after in vivo selection (BM: n = 4 and spleen: n = 10). Black arrows in c and d and labeled IC indicate the band identified by amplification of the proviral internal control sequence that simply indicates presence of the provirus. The amplicons sequenced and listed in Table 1 are marked with black stars in c and d. (M: 1 kb plus ladder)

Similar articles

Cited by

References

    1. De Palma M, Montini E, Santoni de Sio FR, Benedicenti F, Gentile A, Medico E.et al. (2005Promoter trapping reveals significant differences in integration site selection between MLV and HIV vectors in primary hematopoietic cells Blood 1052307–2315. - PubMed
    1. Montini E, Cesana D, Schmidt M, Sanvito F, Ponzoni M, Bartholomae C.et al. (2006Hematopoietic stem cell gene transfer in a tumor-prone mouse model uncovers low genotoxicity of lentiviral vector integration Nat Biotechnol 24687–696. - PubMed
    1. Naldini L, Blömer U, Gallay P, Ory D, Mulligan R, Gage FH.et al. (1996In vivo gene delivery and stable transduction of nondividing cells by a lentiviral vector Science 272263–267. - PubMed
    1. Woods NB, Ooka A., and, Karlsson S. Development of gene therapy for hematopoietic stem cells using lentiviral vectors. Leukemia. 2002;16:563–569. - PubMed
    1. D'Costa J, Mansfield SG., and, Humeau LM. Lentiviral vectors in clinical trials: Current status. Curr Opin Mol Ther. 2009;11:554–564. - PubMed

Publication types