. 2011 Feb 8:2:187.
doi: 10.1038/ncomms1187.

Chromatin remodelling complex dosage modulates transcription factor function in heart development

Affiliations
Free PMC article

Chromatin remodelling complex dosage modulates transcription factor function in heart development

Jun K Takeuchi et al. Nat Commun. .
Free PMC article

Abstract

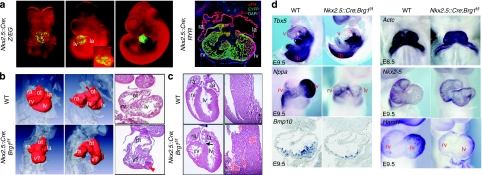
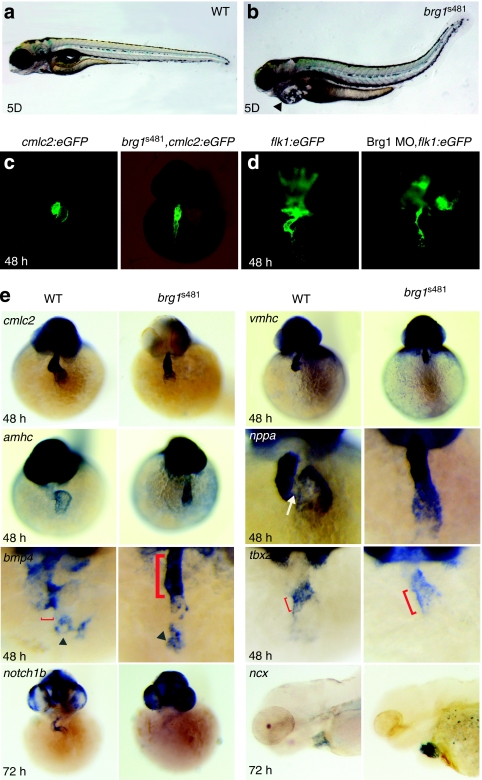
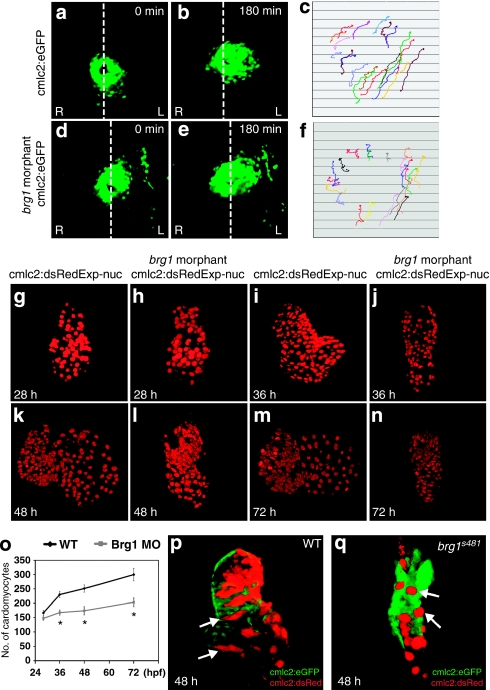
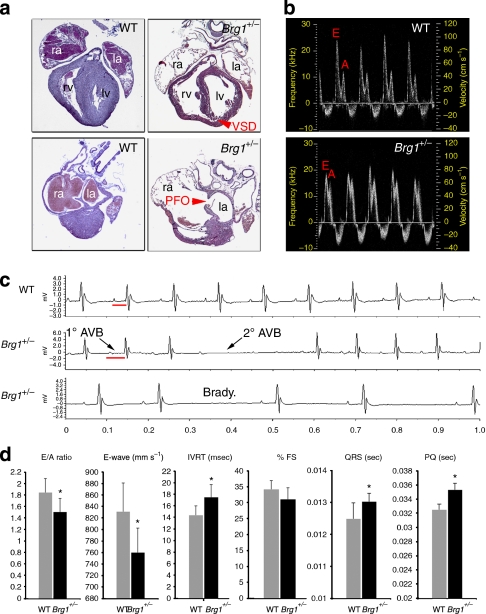
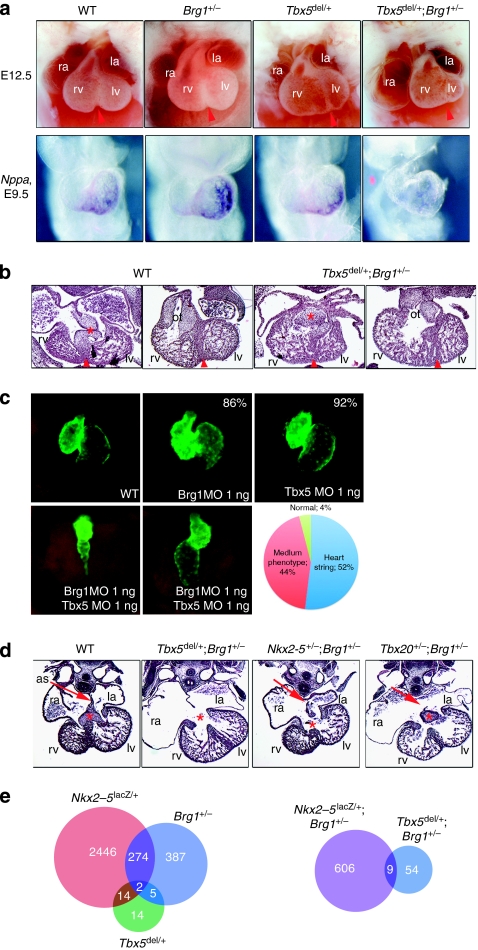
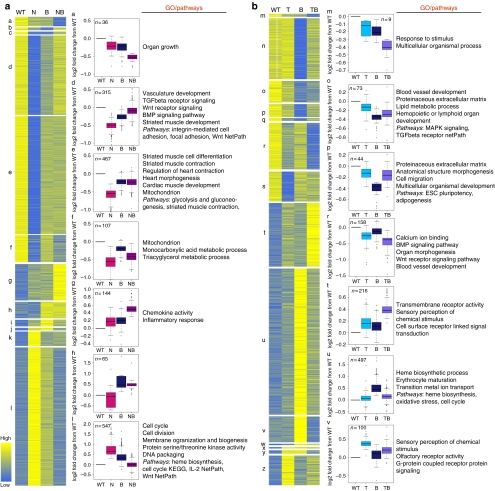
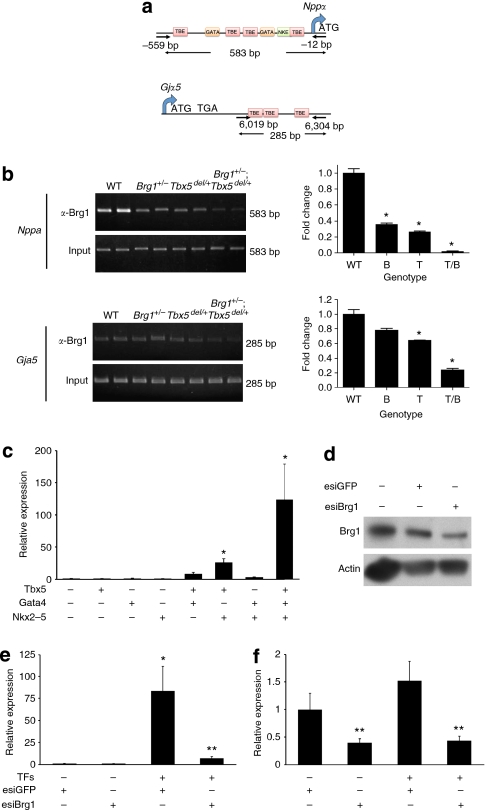
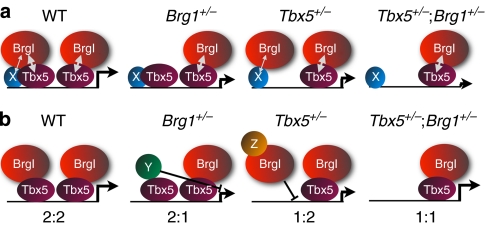
Dominant mutations in cardiac transcription factor genes cause human inherited congenital heart defects (CHDs); however, their molecular basis is not understood. Interactions between transcription factors and the Brg1/Brm-associated factor (BAF) chromatin remodelling complex suggest potential mechanisms; however, the role of BAF complexes in cardiogenesis is not known. In this study, we show that dosage of Brg1 is critical for mouse and zebrafish cardiogenesis. Disrupting the balance between Brg1 and disease-causing cardiac transcription factors, including Tbx5, Tbx20 and Nkx2-5, causes severe cardiac anomalies, revealing an essential allelic balance between Brg1 and these cardiac transcription factor genes. This suggests that the relative levels of transcription factors and BAF complexes are important for heart development, which is supported by reduced occupancy of Brg1 at cardiac gene promoters in Tbx5 haploinsufficient hearts. Our results reveal complex dosage-sensitive interdependence between transcription factors and BAF complexes, providing a potential mechanism underlying transcription factor haploinsufficiency, with implications for multigenic inheritance of CHDs.


Figures

Figure 1
Figure 1. Brg1 is required for early mouse heart formation.
(a) Activity of the Nkx2.5::Cre transgene, using the Z/EG or RYR reporter, at E8.5, 9.5, 11 and 12.5. Inset for E9.5 embryo shows a ventral four-chamber view. For whole-mount pictures, green signal is the activity of the Z/EG reporter, whereas red signal is the bright-field illumination through a red filter. For the RYR reporter, a cryosection stained for anti-EYFP (green), alpha-tropomyosin (red) and 4,6-diamidino-2-phenylindole (blue) is shown. Original magnification: ×25 (whole-mount pictures), ×100 (sections). (b) Frontal view of OPT reconstructions (left panels), lateral view of OPT reconstructions (middle panels) and histology (rightmost panels) of WT and Brg1 mutant (Nkx2.5::Cre;Brg1f/f) mice at E9.5. Arrowhead shows thickened ventricular wall. (c) Histology of postnatal day (P) 1 hearts. Arrow shows membranous ventricular septal defect and double outlet right ventricle in the Nkx2.5::Cre;Brg1f/f heart. Close-up of the interventricular septum (right panels) shows disorganized septum formation. Original magnification: ×100. (d) Gene expression in WT and Nkx2.5::Cre;Brg1f/f mice at E8.5 (Actc1) or E9.5 (all other genes) shows decreased Tbx5, Nppa, Bmp10 and Hand1 expression. la, left atrium; lb, limb bud; lv, left ventricle; ra, right atrium; rv, right ventricle; v, ventricle; v?, ventricle of ambiguous identity.
Figure 2
Figure 2. Loss of Brg1 leads to heart development defects in the zebrafish embryos.
(a, b) Lateral views at 5 dpf of WT (a) and brg1s481 (b) zebrafish embryos. Arrowhead in b shows pericardial oedema. (c, d) Frontal views of WT or brg1s481 zebrafish embryos at 48 hpf, showing myocardium, labelled with cmlc2:eGFP (c), and endocardium, labelled with flk1:eGFP (d). Original magnification: ×100. (e) Cardiac gene expression in WT and brg1s481 zebrafish embryos for indicated transcripts (left panels, top to bottom: cmlc2, amhc, bmp4 and notch1b; right panels, top to bottom: vmhc, nppa, tbx2b and ncx). White arrow shows normal absence of nppa at the atrioventricular (AV) junction, grey triangles show staining of pacemaker cells, red brackets show normal and expanded domains of AV canal markers (bmp4 and tbx2b). Original magnification: ×200.
Figure 3
Figure 3. Defective cardiomyocyte migration and cell shape in zebrafish brg1 mutants.
(af) Imaging of atrial cell migration in WT embryos (ac) and brg1 morphants (df). (a, b, d, e) Dorsal views of heart in Tg(cmlc2:eGFPtwu34) embryos between 18 and 21 hpf; dotted white lines indicate the embryonic midline. (c, f) Arrows of different colours indicate the trajectories of individual cells. Original magnification: ×200. (go) Measurement of cardiomyocyte numbers. Three-dimensional reconstructions of the nuclear DsRed signal from Tg(cmlc2:dsRedExp-nuchsc4) embryos are shown (gn). The 28 hpf embryos (g, h) are shown in dorsal view, the 36 hpf (i, j), 48 hpf (k, l) and 72 hpf (m, n) embryos are shown in anterior views. (o) Quantitation of cardiomyocyte cell numbers. Data are mean±s.d., n=5–8 embryos; *P<0.05 by t-test. Original magnification: ×400. (p, q) Three-dimensional assessment of cell morphologies in Tg(cmlc2:eGFPtwu34)-expressing hearts that exhibit mosaic expression of Tg(cmlc2:dsRedExp-nuchsc4). Arrows point to representative cells. (p) WT cells transplanted; (q) brg1s481 cells transplanted. Original magnification: ×400. A, atrium; L, left; R, right; V, ventricle.
Figure 4
Figure 4. CHDs in Brg1 heterozygous null mice.
(a) Histology of postnatal day 0 WT (left panels) and Brg1+/− hearts (right panels), showing dilated chambers, muscular ventricular septal defect (VSD) and patent foramen ovale (PFO) in Brg1+/− hearts. Top and bottom panels are planes of section of the same heart at the level of the outflow tract (top panels) and at the level of the atrial septum (bottom panels). Original magnification: ×50. (b) Doppler waveforms of flow at the mitral valve of adult WT and Brg1+/− mice, showing altered E and A wave amplitudes in Brg1+/− mice. (c) ECG telemetry in WT and Brg1+/− mice, showing prolonged PQ interval, sinus pause and second-degree atrioventricular block in Brg1+/− mice. (d) Quantitation of selected parameter in WT (grey bars) and Brg1+/− (black bars) mice. Units of measure are indicated in parentheses next to the graphed metric title. Data are mean±s.d.; n=5; *P<0.05. la, left atrium; lv, left ventricle; ra, right atrium; rv, right ventricle.
Figure 5
Figure 5. Genetic interactions between Brg1 and cardiac transcription factor genes.
(a) Brg1 and Tbx5 genetically interact. The top row shows an external view of hearts from E12.5 WT, Brg1+/−, Tbx5del/+ and Brg1+/−;Tbx5del/+ embryos; the bottom row shows expression of Nppa at E9.5 for the same genotypes. Original magnification: ×50. (b) Histology of E11.5 WT and Brg1+/−;Tbx5del/+ embryos. Brg1+/− or Tbx5del/+ embryos are indistinguishable from WT. Asterisk indicates atrioventricular cushion and arrowhead indicates interventricular septum. Original magnification: ×100. (c) Brg1 and Tbx5 interactions in zebrafish. Tg(cmlc2:eGFPtwu34) control (WT) or MO-injected embryos are shown in ventral–anterior views at 72 hpf. Brg1MO: MO directed against Brg1; Tbx5MO: MO directed against Tbx5. All MOs were injected at 1 ng. Percentages in the Brg1MO and Tbx5MO show the percentage of normal hearts. The graph shows the percentage of phenotypes observed in double knockdown experiments (n=74, 91 and 126 for brg1, tbx5 and brg1+tbx5 morpholino injections, respectively). Original magnification: ×400. (d) Brg1 genetically interacts with Tbx5, Nkx2–5 and Tbx20. Histology of E12.5 hearts shows specific defects in Brg1+/−;Tbx5del/+, Brg1+/−;Nkx2–5+/− and Brg1+/−;Tbx20+/− embryos, compared with WT. Nkx2–5+/− and Tbx20+/− hearts are structurally identical to WT hearts. Asterisk indicates atrioventricular cushion and arrow indicates atrial septum (as). Original magnification: ×100. (e) Summary of microarray analysis performed on E11.5 hearts of the indicated genotypes. Venn diagrams show the number of altered transcripts for each genotype, using a statistical cutoff of P<0.01 and fold change >0.3. la, left atrium; lv, left ventricle; ot, outflow tract; ra, right atrium; rv, right ventricle.
Figure 6
Figure 6. Clustering analysis of altered gene expression.
(a) Clustering analysis of altered transcripts from Nkx2–5+/− (N), Brg1+/− (B) and compound heterozygotes, Nkx2–5+/−;Brg1+/− (NB) E11.5 hearts. Heart maps for all statistically significant clusters indicate the average value for each group. All biological replicates within groups were included in cluster analyses; figures were made by taking the mean for each group. Box plots for a selection of clusters show the median (middle line), third and first quartile (top and bottom (hinges) of the boxes); the 'whiskers' extend 1.5× the length of the box, with other points (outliers) plotted as circles. Statistically significantly overrepresented Gene Ontology (GO) categories (adjusted P<0.01) are shown. Genotypes are shown on the x axis; y axis shows log 2 fold change from WT. (b) Clustering analysis as in B, but for transcripts from Tbx5del/+ (T), Brg1+/− (B) and compound heterozygotes, Tbx5del/+;Brg1+/− (TB) E11.5 hearts.
Figure 7
Figure 7. Direct interactions between Brg1 and cardiac transcription factors.
(a) Diagram indicating the location of primer pairs for amplification of immunoprecipitated chromatin-associated DNA for Nppa and Gja5. Locations of conserved T-box-binding elements (TBE), GATA factor-binding sites (GATA) and Nkx2–5-binding sites (NKE) are shown. ATG: start codon; TGA: translational stop codon. Nucleotide positions shown are relative to start codon. (b) ChIP of Brg1 at the Nppa or Gja5 promoters from E9.5 hearts of the indicated genotypes. On the left are EtBr-stained gels showing amplification, and quantitation by QPCR is shown in the graphs on the right. Data are mean±s.e.; n=3; *P<0.05. (c) Quantitation of Nppa mRNA in NIH3T3 fibroblasts transfected with combinations of Tbx5, Nkx2–5 and Gata4. Data are mean±s.e.; n=3; *P<0.05 versus mock transfection. (d) Western blot to measure reduction of Brg1 protein levels by anti-Brg1 esiRNAs. Actin is a loading control. (e) Quantitation of Nppa mRNA in NIH3T3 fibroblasts transfected with Tbx5, Nkx2–5 and Gata4, with or without esiRNAs targeting Brg1, or control esiRNAs. TFs=Tbx5, Gata4 and Nkx2–5. Data are mean±s.e.; n=3; *P<0.05 versus mock transfection; **P<0.05 esiBrg1+ versus esiBrg1. (f) Brg1 mRNA levels in the same samples as in c. Data are mean±s.e.; n=3; **P<0.05 esiBrg1+ versus esiBrg1.
Figure 8
Figure 8. Models for the interaction between DNA-binding transcription factors and Brg1.
Two models for the interaction between DNA-binding transcription factors and Brg1. Model (a) is based on the dosage-sensitive interrelationship between DNA-binding transcription factors (represented by Tbx5) and Brg1. In Brg1+/− hearts, some Tbx5-binding events are not accompanied by concomitant Brg1 binding, resulting in decreased gene expression. In Tbx5+/− hearts, Brg1 can only interact with one of two potential Tbx5-binding events, but may still interact more weakly with other DNA-binding transcription factors (X). In Tbx5+/−;Brg1+/− hearts, all quantitative interactions are impaired, leading to further reduction in target gene expression. Model (b) is based on the normalization of gene expression in Tbx5+/−;Brg1+/− and Nkx2-5+/−;Brg1+/− hearts, and is based on the allelic balance between the two genes. In Brg1+/− hearts, the ratio of Tbx5 to Brg1 alleles is now 2:1, which allows some Tbx5-binding events to interact with other factors, including a hypothetical repressor protein (Y). In Tbx5+/− hearts, the ratio of Tbx5 to Brg1 alleles is now 1:2, which allows some Brg1-binding events to interact with other factors, including a hypothetical repressor or sequestrating protein (Z). In Tbx5+/−;Brg1+/− hearts, the balance is restored to 1:1, eliminating the potential for other interactions.

Similar articles

Cited by

References

    1. Olson E. N. Gene regulatory networks in the evolution and development of the heart. Science 313, 1922–1927 (2006). - PMC - PubMed
    1. Srivastava D. Making or breaking the heart: from lineage determination to morphogenesis. Cell 126, 1037–1048 (2006). - PubMed
    1. Bruneau B. G. The developmental genetics of congenital heart disease. Nature 451, 943–948 (2008). - PubMed
    1. Bruneau B. G. et al.. A murine model of Holt-Oram syndrome defines roles of the T-box transcription factor Tbx5 in cardiogenesis and disease. Cell 106, 709–721 (2001). - PubMed
    1. Garg V. et al.. GATA4 mutations cause human congenital heart defects and reveal an interaction with TBX5. Nature 424, 443–447 (2003). - PubMed

Publication types

MeSH terms

Associated data