. 2011 Mar 1;104(5):798-807.
doi: 10.1038/bjc.2011.12. Epub 2011 Feb 8.

Silencing of ferrochelatase enhances 5-aminolevulinic acid-based fluorescence and photodynamic therapy efficacy

Affiliations

Silencing of ferrochelatase enhances 5-aminolevulinic acid-based fluorescence and photodynamic therapy efficacy

L Teng et al. Br J Cancer. .

Abstract

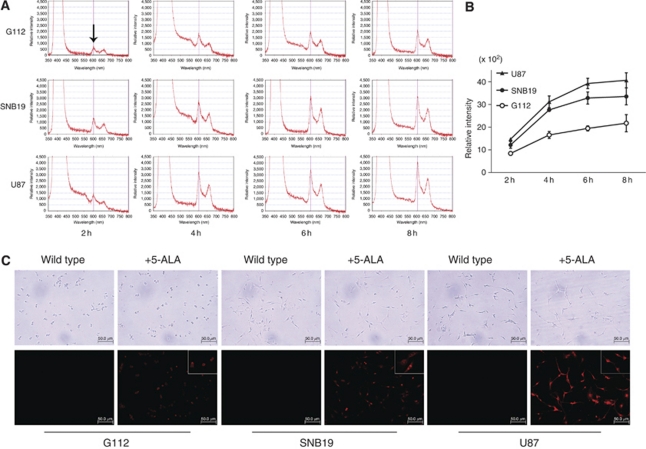
Background: Recurrence of glioma frequently occurs within the marginal area of the surgical cavity due to invading residual cells. 5-Aminolevulinic acid (5-ALA) fluorescence-guided resection has been used as effective therapeutic modalities to improve discrimination of brain tumour margins and patient prognosis. However, the marginal areas of glioma usually show vague fluorescence, which makes tumour identification difficult, and the applicability of 5-ALA-based photodynamic therapy (PDT) is hampered by insufficient therapeutic efficacy in glioma tissues.

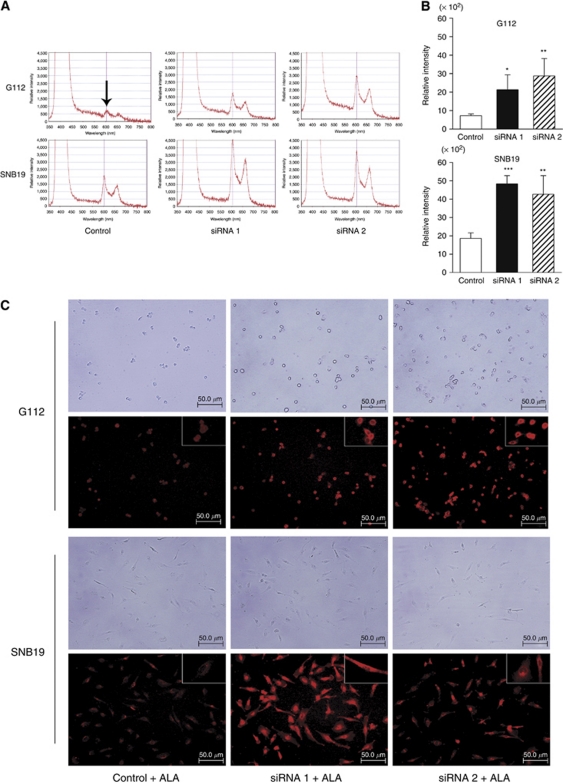
Methods: To overcome these issues, we assessed the expression of ferrochelatase (FECH) gene, which encodes a key enzyme that catalyses the conversion of protoporphyrin IX (PpIX) to heme, in glioma surgical specimens and manipulated FECH in human glioma cell lines.

Results: Prominent downregulation of FECH mRNA expression was found in glioblastoma tissues compared with normal brain tissues, suggesting that FECH is responsible for PpIX accumulation in glioblastoma cells. Depletion of FECH by small interference RNA enhanced PpIX fluorescence after exposure to 5-ALA concomitant with increased intracellular PpIX accumulation in glioma cells. Silencing of FECH caused marked growth inhibition and apoptosis induction by PDT in glioma cells.

Conclusion: These results suggest that knockdown of FECH is a potential approach to enhance PpIX fluorescent quality for optimising the subjective discrimination of vague fluorescence and improving the effect of 5-ALA-PDT.


Conflict of interest statement

Y Endo obtained the research grant from the company that provided PpIX fluorescence spectral intensity analysis. The other authors declare no conflict of interest.

Figures

Figure 1
Figure 1
Expression levels of FECH mRNA in various human gliomas and immunolocalization of FECH in glioblastoma and normal brain tissues. (A) Relative mRNA expression levels of the FECH gene (FECH mRNA: β-actin mRNA ratios) in normal brains (NBs), diffuse astrocytomas (DA), anaplastic astrocytomas (AA), and glioblastomas (GBM) were analyzed by QRT–PCR. FECH mRNA expression levels were significantly lower in glioblastomas compared with normal brains, diffuse astrocytomas and anaplastic astrocytomas (*P<0.05; ***P<0.005). Data are expressed as means±s.e. (B) Immunolocalization of FECH in invading edge of glioblastoma (upper left: glioblastoma; lower right: normal brain, panel a), glioblastoma (panel b) and normal brain tissues (panels c and d). Paraffin sections were immunostained with anti-FECH antibodies (panels a, b and c) or non-immune rabbit IgG (panel d). Note that FECH is immunolocalized in the normal astrocytes (panel c, arrow head) and neurons (panel c, thin arrows). Faint staining is detected in neoplastic astrocytes (panel b, thick arrows), whereas no staining is observed in the normal brain with non-immune IgG (panel d).
Figure 2
Figure 2
FECH mRNA and protein expression in glioma cell lines. (A) QRT–PCR was used to determine FECH mRNA expression levels in G112, SNB19, and U87 glioma cell lines. Data are expressed as mean (s.d.) of triplicate experiments. (B) Western blotting shows FECH protein in the glioma cell lines. The total cell lysates were immunoblotted with FECH and β-actin antisera.
Figure 3
Figure 3
PpIX accumulation in glioma cells after 5-ALA exposure. (A) PpIX fluorescence spectra tracing at various time points. The peak at 605 nm (arrow) indicates the characteristic PpIX fluorescence spectra. x-axis: wavelength; y-axis: relative intensity. (B) The time-dependent PpIX accumulation curve was drawn according to the results of (A). PpIX fluorescence spectral intensity reached a plateau at ∼6 h in U87 and SNB19. The data are based on three independent experiments, and the error bars show mean (s.d.). (C) Molecular imaging of PpIX was visualised by fluorescence microscopy in G112, SNB19, and U87 cells that were incubated for 6 h with 5-ALA. Upper panels: phase-contrast images; lower panels: PpIX molecular images, insets: higher magnification.
Figure 4
Figure 4
Efficiency of FECH siRNA silencing in glioma cell lines. (A) FECH siRNA sequence 1 and sequence 2 were transfected into G112 and SNB19 cells. Luciferase was transfected as a negative control, and total RNA was extracted from the cells 72 h later for cDNA synthesis. FECH mRNA expression after transfection was determined by QRT–PCR. (B) Micrographs of FECH protein labeled by green-fluorescent Alexa Fluor 488 dye (Invitrogen, Carlsbad, CA, USA) in G112 and SNB19 glioma cells transfected with siRNA. Green fluorescence intensity significantly decreased in FECH siRNA sequence 1 and sequence 2 compared with control siRNA. Representative micrographs of three independent experiments are shown.
Figure 5
Figure 5
PpIX fluorescence spectra analysis and molecular images of glioma cells transfected with siRNA. (A) PpIX fluorescence spectra tracing at 6 h after FECH or luciferase siRNA transfection and incubation with 400 μM 5-ALA. The peak at 605 nm (arrow) indicates the characteristic PpIX fluorescence spectra. x-axis: wavelength; y-axis: relative intensity. (B) Histogram of PpIX relative fluorescence intensity of cells transfected with siRNA after 6-h exposure to 400 μM 5-ALA. PpIX fluorescence spectral intensity was significantly increased in the cells transfected with FECH siRNA sequence 1 and sequence 2 compared with that in the cells transfected with control siRNA (*P<0.05; **P<0.01; ***P<0.005). Data are expressed as mean (s.d.) of triplicate experiments. (C) PpIX molecular images of glioma cells transfected with FECH siRNA. Molecular images of PpIX were visualized by fluorescence microscopy in G112 and SNB19 glioma cells. After 72-h FECH siRNA transfection, the cells were exposed to 400 μM 5-ALA for 6 h. Note that strong red fluorescence of glioma cells was observed in cells transfected with FECH siRNA compared with control siRNA. Upper panels: phase-contrast images; lower panels: PpIX molecular images, insets: higher magnification.
Figure 6
Figure 6
Proliferation curve of glioma cells transfected with FECH siRNA after light irradiation. Luciferase and FECH siRNA sequence 1 and sequence 2 were transfected into G112 and SNB19 cells for 72 h and then cells were exposed to 400 μM 5-ALA for 6 h. The cells were irradiated with 0.5 J cm−2 or 1 J cm−2 light fluence and then analyzed using Alamar Blue assay (Biosource, Camarillo, CA, USA). Data are expressed as mean (s.d.) of octuple experiments (***P<0.005).
Figure 7
Figure 7
Apoptosis analysis of glioma cells transfected with FECH siRNA after light irradiation. Cells were harvested 24 h after transfection and light irradiation and then subjected to combined staining with propidium iodide and Annexin V. The number in each quadrant indicates the proportion of the cells that are present in the quadrant. Results are representative of three independent experiments.

Similar articles

Cited by

References

    1. Angell-Petersen E, Hirschberg H, Madsen SJ (2007) Determination of fluence rate and temperature distributions in the rat brain; implications for photodynamic therapy. J Biomed Opt 12: 014003. - PubMed
    1. Au CM, Luk SK, Jackson CJ, Ng HK, Yow CM, To SS (2006) Differential effects of photofrin, 5-aminolevulinic acid and calphostin C on glioma cells. J Photochem Photobiol B 85: 92–101 - PubMed
    1. Aydin H, Sillenberg I, von Lieven H (2001) Patterns of failure following CT-based 3-D irradiation for malignant glioma. Strahlenther Onkol 177: 424–431 - PubMed
    1. Ennis SR, Novotny A, Xiang J, Shakui P, Masada T, Stummer W, Smith DE, Keep RF (2003) Transport of 5-aminolevulinic acid between blood and brain. Brain Res 959: 226–234 - PubMed
    1. Ferreira GC, Franco R, Lloyd SG, Moura I, Moura JJ, Huynh BH (1995) Structure and function of ferrochelatase. J Bioenerg Biomembr 27: 221–229 - PubMed

Publication types