

Intra- and multicenter reproducibility of pulsed, continuous and pseudo-continuous arterial spin labeling methods for measuring cerebral perfusion
- PMID: 21304555
- PMCID: PMC3170937
- DOI: 10.1038/jcbfm.2011.10
Intra- and multicenter reproducibility of pulsed, continuous and pseudo-continuous arterial spin labeling methods for measuring cerebral perfusion
Abstract
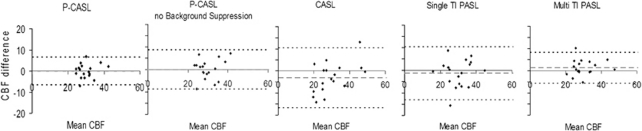
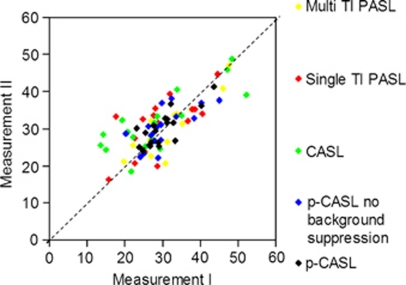
Intra- and multicenter reproducibility of currently used arterial spin labeling (ASL) methods were assessed at three imaging centers in the Netherlands, equipped with Philips 3TMR scanners. Six healthy participants were scanned twice at each site. The imaging protocol consisted of continuous ASL (CASL), pseudo-continuous ASL (p-CASL) with and without background suppression, pulsed ASL (PASL) with single and multiple inversion times (TIs), and selective ASL for segmentation. Reproducibility was expressed in terms of the coefficient of repeatability and the repeatability index. Voxelwise analysis of variance was performed, yielding brain maps that reflected regional variability. Intra- and multicenter reproducibility were comparable for all methods, except for single TI PASL, with better intracenter reproducibility (F-test of equality of two variances, P<0.05). Pseudo-continuous ASL and multi TI PASL varied least between sites. Variability maps of all methods showed most variability near brain-feeding arteries within sessions and in gray matter between sessions. On the basis of the results of this study, one could consider the use of reference values in clinical routine, with whole-brain p-CASL perfusion varying <20% over repeated measurements within the same individuals considered to be normal. Knowledge on regional variability allows for the use of perfusion-weighted images in the assessment of local cerebral pathology.
Figures


References
-
- Alsop DC, Detre JA. Multisection cerebral blood flow MR imaging with continuous arterial spin labeling. Radiology. 1998;208:410–416. - PubMed
-
- Anbeek P, Vincken KL, van Osch MJ, Bisschops RH, van der Grond J. Probabilistic segmentation of white matter lesions in MR imaging. Neuroimage. 2004;21:1037–1044. - PubMed
-
- Bland JM, Altman DG. Statistical methods for assessing agreement between two methods of clinical measurement. Int J Nurs Stud. 2010;47:931–936. - PubMed
-
- Buxton RB, Frank LR, Wong EC, Siewert B, Warach S, Edelman RR. A general kinetic model for quantitative perfusion imaging with arterial spin labeling. Magn Reson Med. 1998;40:383–396. - PubMed
MeSH terms
Substances
LinkOut - more resources
Full Text Sources
